Cloud Total Cost of Ownership: A Practical Guide
The finance team is staring at a quarterly cloud invoice of $480,000, while the migration forecast promised $310,000. Engineering points to traffic growth. Finance points to the model. Both are missing the same issue: the invoice was never the total cost of ownership.
If you're rebuilding a cloud budget, start with the operating decisions that keep the number honest six months later. Use this guide to model the full lifecycle, expose hidden spend, and put scheduling, rightsizing, and governance into production. For practical ROI modeling alongside cloud planning, see this ROI calculation approach in Excel.
Contents
Ready to Slash Your AWS Costs?
Stop paying for idle resources. Server Scheduler automatically turns off your non-production servers when you're not using them.
What Cloud TCO Really Means
A cloud budget can look controlled until migration work, engineering time, security tooling, and exit planning appear outside the provider invoice. Cloud total cost of ownership is the fully loaded cost of running a workload across its useful life. AWS's public-cloud economics guidance separates provider charges from non-provider costs such as labor, software, and supporting services. AWS's public-cloud economics guidance supports that broader view.
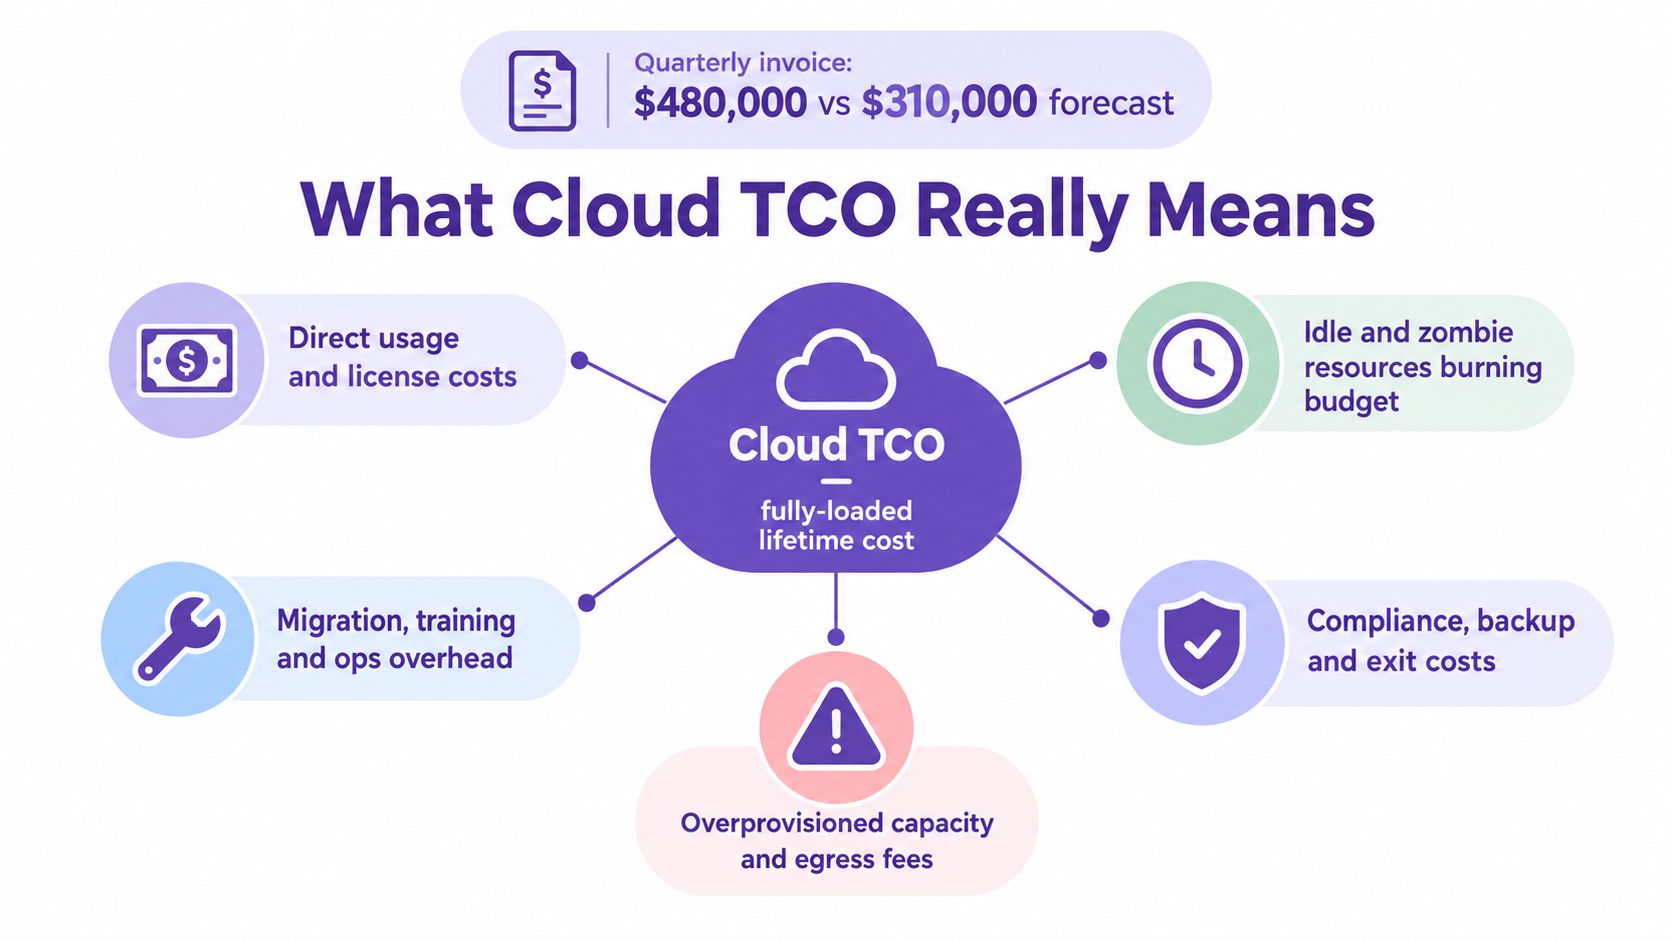
TCO answers a planning question, not a billing question. Finance uses it to compare build options and defend budget requests. Engineering uses it to test architecture assumptions, while leadership uses it to assess migration, modernization, or continued on-premises operation.
TCO also differs from unit economics. Cost per user, cost per transaction, and gross margin contribution show whether a product scales efficiently. TCO shows the cost of owning and operating the underlying environment over its useful life. Track both metrics, and keep their purposes separate. For a worked ROI model you can adapt, see this ROI calculation approach in Excel.
Build the model across three horizons
A credible model covers three periods:
- Migration: data movement, professional services, refactoring, training, and parallel operation.
- Steady state: compute, storage, network, licenses, people, support, monitoring, backup, and governance.
- Exit: data extraction, application refactoring, contract commitments, and the work required to move or retire workloads.
The provider calculator is the easy part. Document assumptions that engineering can challenge, including utilization, traffic paths, retention policies, recovery requirements, staffing coverage, and ownership. Vendor defaults can create a precise estimate for an environment you will never run.
Practical rule: If a cost disappears when you stop looking at the provider invoice, it still belongs in TCO.
The Cost Components You Must Include
A serious model starts with direct consumption, then adds the operating machinery around it. For example, 40 production VMs might represent roughly $3,200 per month in EC2-equivalent compute, or about $128,000 per quarter. That figure says nothing about storage, egress, database licensing, or the people keeping those VMs healthy.
Storage deserves its own line. 250 TB across hot, warm, and archive tiers at a blended $23 per TB-month produces roughly $5,750 before retrieval and transfer considerations. Network costs also need separation: $4,800 monthly egress to customers can sit beside NAT gateway charges and inter-region traffic, where teams often lump unlike costs together.
Licensing is another frequent omission. SQL Server Standard at $215 per vCPU-month across 64 vCPUs comes to roughly $13,760 per month. Add three platform engineers at $160,000 fully loaded each for cloud-only work, monitoring and logging at 8% of direct spend, backup tooling, DR drills, and security controls. Multi-AZ replication can add 35% to storage, while a standby environment creates a recurring resilience baseline.
Migration belongs in the same model. $180,000 in professional services plus six months of parallel running can change the economics of an otherwise attractive move. The same discipline applies to ERP and other transformation programs, where ERP cost and resource planning offers useful context for mapping labor, timing, and resource assumptions.
| Category | What to Include | Quarterly Example ($) |
|---|---|---|
| Compute | VMs, containers, serverless execution | 128,000 |
| Storage | Hot, warm, archive, retrieval | 17,250 |
| Network | Egress, NAT, inter-region transfer | 14,400 plus NAT |
| Licensing | Operating systems and databases | 41,280 |
| People | Platform, security, and FinOps labor | Fully loaded staffing |
| Operations | Monitoring, logging, backup, DR | 8% of direct spend |
| Resilience | Multi-AZ and standby capacity | Storage uplift plus standby |
| Migration | Services and parallel run | 180,000 plus six months |
Use an AWS bill breakdown explainer to translate invoice categories into resource-level questions before you finalize the forecast.
Cloud Versus On-Premises at a Glance
A stable, heavily utilized workload can make owned infrastructure the better financial choice. A product team facing unpredictable demand may reach the opposite conclusion because cloud capacity arrives without a hardware purchase. Choose the operating model around demand, utilization, delivery speed, residency requirements, and the control your workloads require.
The comparison extends beyond CapEx versus OpEx. On-premises infrastructure may need a hardware refresh every four to five years, costing roughly $1.2 million for a comparable footprint. Cloud removes that purchase, then replaces it with recurring consumption, platform labor, commitments, transfer charges, and exit exposure. Model those operating decisions over several years, not as a snapshot of one invoice. For the CapEx and OpEx framing, use Flexera's State of the Cloud report.
| Dimension | Cloud | On-Premises |
|---|---|---|
| Upfront investment | Lower initial hardware commitment, ongoing OpEx | Significant CapEx and refresh planning |
| Elasticity | Absorbs a 5x traffic spike in minutes | Capacity must be purchased for peak |
| Staffing | Platform engineering and FinOps discipline | Hardware-aware operations team |
| Compliance | Flexible controls, provider-specific constraints | Strong control for regulated or air-gapped workloads |
| Time to market | New environments can be ready in hours | Procurement and installation can take weeks |
| Exit | Egress, refactoring, and contract switching costs | Hardware investment is already sunk |
| Best fit | Variable demand and rapid delivery | Predictable, mature, highly utilized workloads |
Cloud is not automatically cheaper at scale. A 2026 analysis of 300 enterprise workloads found that at 500 or more VMs, mature on-premises environments were only 12% more expensive than equivalent cloud spend when staffing, capital, and egress were modeled correctly. hybrid cloud operations can support a practical split. Keep predictable or restricted workloads where they fit economically, and use cloud for burst capacity and fast-changing services. Recheck that boundary after scheduling, rightsizing, and governance changes. The calculator sets the baseline. Operations determine whether the result still holds six months later.
A Repeatable TCO Calculation Method
Run the model as an operating process, not a one-time presentation.
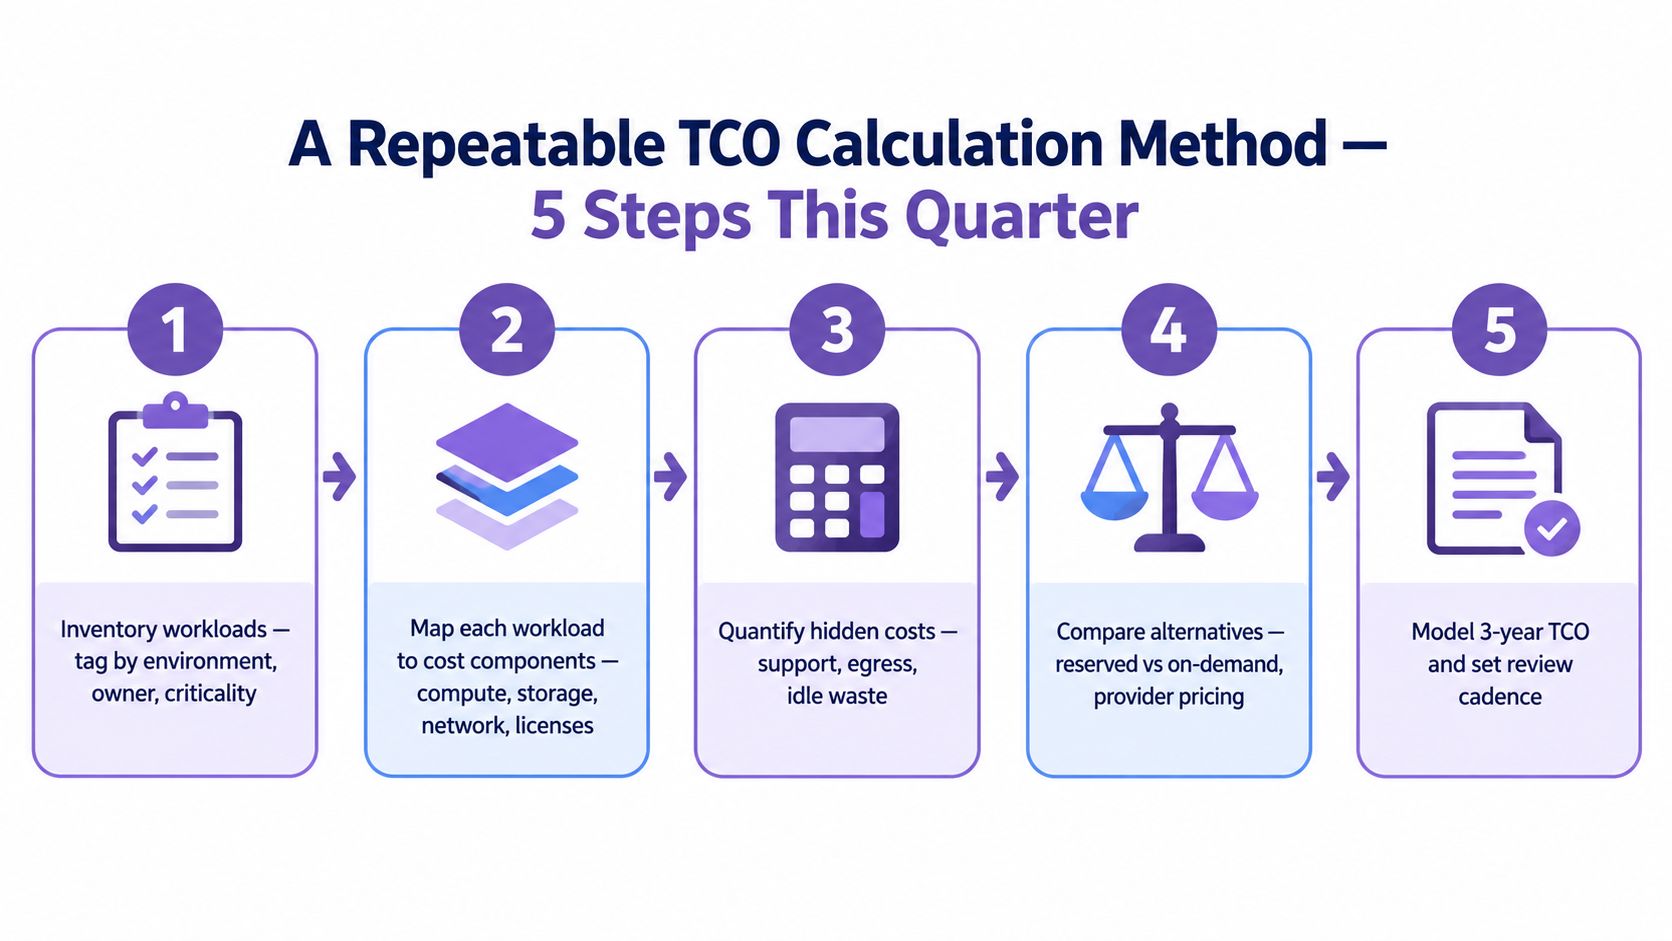
Five steps for this quarter
- Inventory workloads. Tag every resource by environment, owner, criticality, and application.
- Map unit costs. Assign compute, storage, network, license, and resilience costs to each workload.
- Add indirect cost. Start with 30% to 50% of direct spend for people, operations, and resiliency, then replace the assumption with actuals.
- Choose the horizon. A 36-month view is usually useful. Apply an annual discount rate of 8% to 12% when finance requires present-value analysis.
- Calibrate against reality. Reconcile the model with three months of invoices and investigate every material variance.
A mini-example shows why the arithmetic must include overhead. 20 production EC2 instances at roughly $110 per month each, plus 1.5 TB of storage, 2 TB of egress, and 40% indirect overhead, lands near $5,800 monthly, or about $195,000 over three years. Those figures are an illustrative model, not a universal rate card. Replace them with your provider, region, contract, and traffic data.
Keep migration and exit outside the steady-state run-rate so decision-makers can see the full lifecycle separately. The AWS cost savings calculator can support scenario testing, but it won't know your staffing model or governance burden.
Hidden Costs and Common Pitfalls
The biggest surprises usually come from movement, idle capacity, and resources nobody owns. Independent coverage estimates hidden networking items can add 20% to 40% to true cloud spend, with 30% to 35% of cloud spend potentially unclassified or hidden. This analysis of network and egress costs is especially relevant to analytics-heavy and globally distributed architectures.
Egress and inter-region transfer fees surface after application traffic settles. NAT gateways, availability-zone transfers, replication, and backup copies can grow faster than the compute line. Providers generally charge when data leaves a region or platform, so cloud TCO guidance on egress should be treated as an architecture input, not a billing footnote.
| Hidden Cost | Typical Share of Bill | Detection Signal |
|---|---|---|
| Egress and cross-region transfer | 20% to 40% of true spend in hidden-cost coverage | Transfer rises faster than workload volume |
| Unclassified spend | 30% to 35% in cited market coverage | Missing owner or allocation tag |
| Idle non-production | Varies by schedule and utilization | Resources run outside work windows |
| Orphaned storage | Varies | Unattached volumes and old snapshots |
| NAT and zone traffic | Varies | Network charges exceed expected paths |
| License drift | Varies | Unexpected Windows, SQL Server, or Oracle charges |
| Multi-region DR | Varies | Storage and transfer baseline expands suddenly |
Require allocation tags, run monthly orphan scans, and maintain a one-page runbook that flags any resource above a fixed dollar threshold. Finance teams evaluating expansion should also account for the broader costs of fast business expansion, because cloud capacity often grows before revenue processes catch up.
Proven Levers to Reduce Cloud TCO
Start with waste that requires no architecture change.
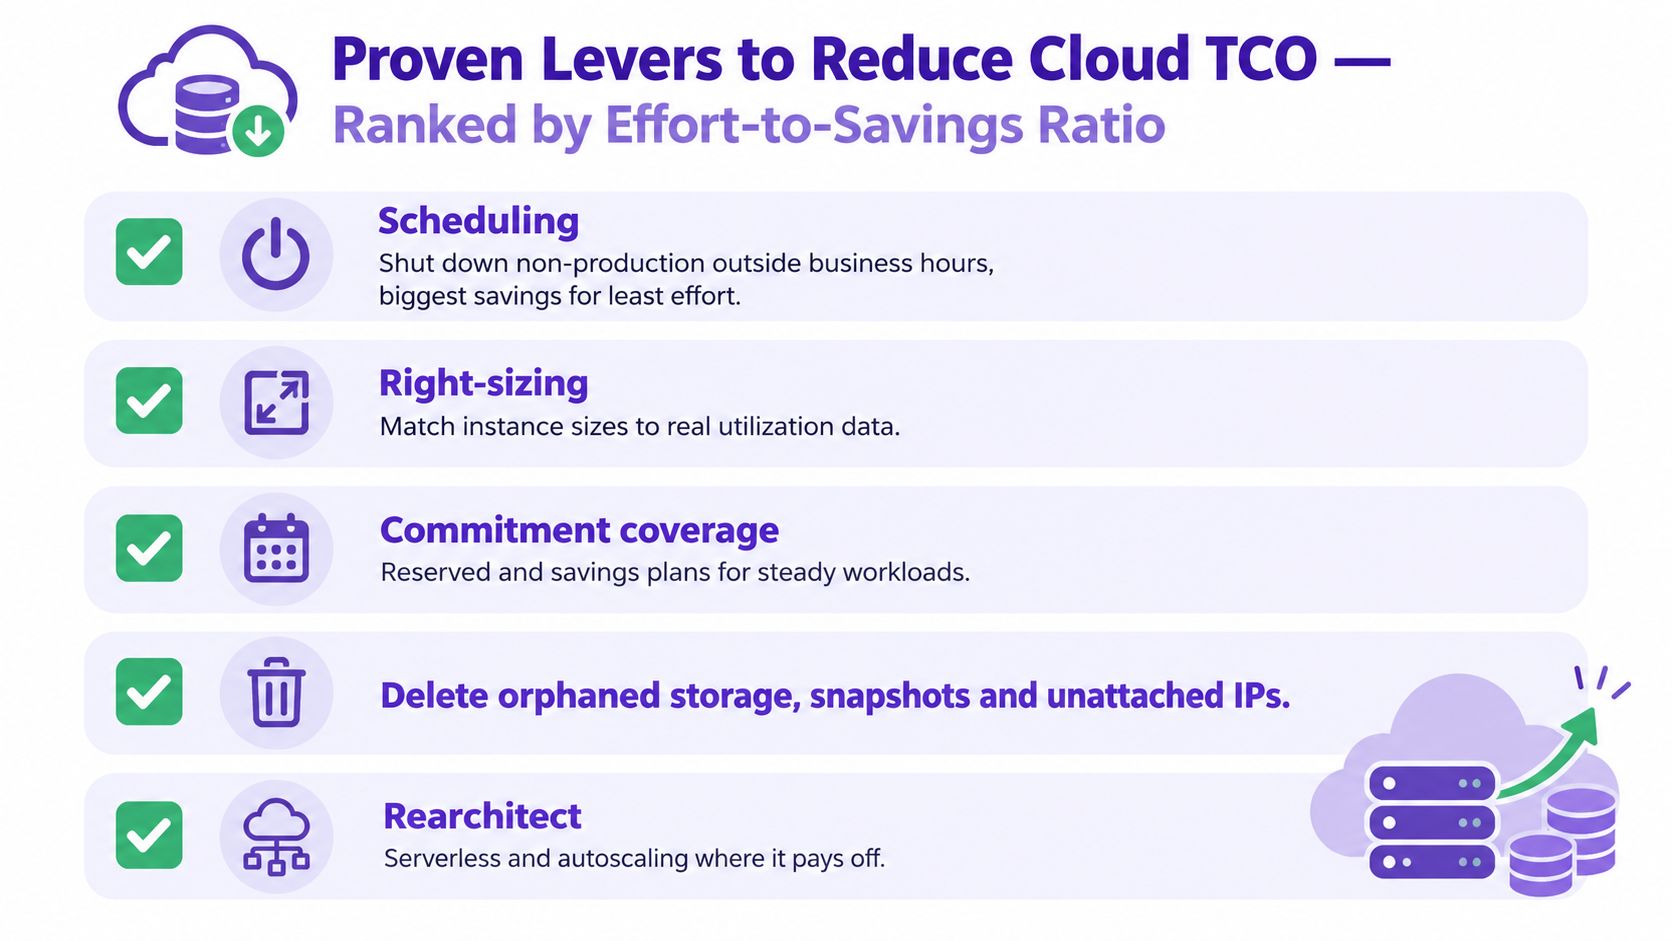
Scheduling is the first move for development, test, staging, and batch environments. Automated shutdowns outside work hours can reduce non-production costs by up to 70%, according to AWS guidance on usage management. The saving comes from removing idle runtime, not from squeezing performance.
Rightsize next. Review 14 to 30 days of utilization data, then reduce consistently underused CPU, memory, or storage capacity. Commitments belong after that review. Reserved Instances and Savings Plans can cover a proven baseline, while Spot capacity fits interruption-tolerant workloads. Cloud TCO optimization guidance supports evaluating maintenance, governance, and lifecycle costs alongside list price.
Sequence the work by confidence
- Month one: schedule non-production shutdowns, remove orphaned resources, and rightsize obvious overprovisioning.
- Month two: commit only the stable baseline after utilization has settled.
- Month three: formalize tagging, chargeback, budget alerts, and weekly FinOps review.
Automation should enforce storage lifecycle policies, autoscaling, cleanup scripts, and ownership checks. Set alerts at 80% and 100% of budget thresholds, then assign a person to investigate each alert. A tool such as Server Scheduler can schedule start, stop, resize, and reboot actions for AWS EC2, RDS, and ElastiCache without requiring cron jobs or infrastructure code. More implementation detail is available in this guide to reducing AWS costs.
A 90-Day Plan and Quick Answers
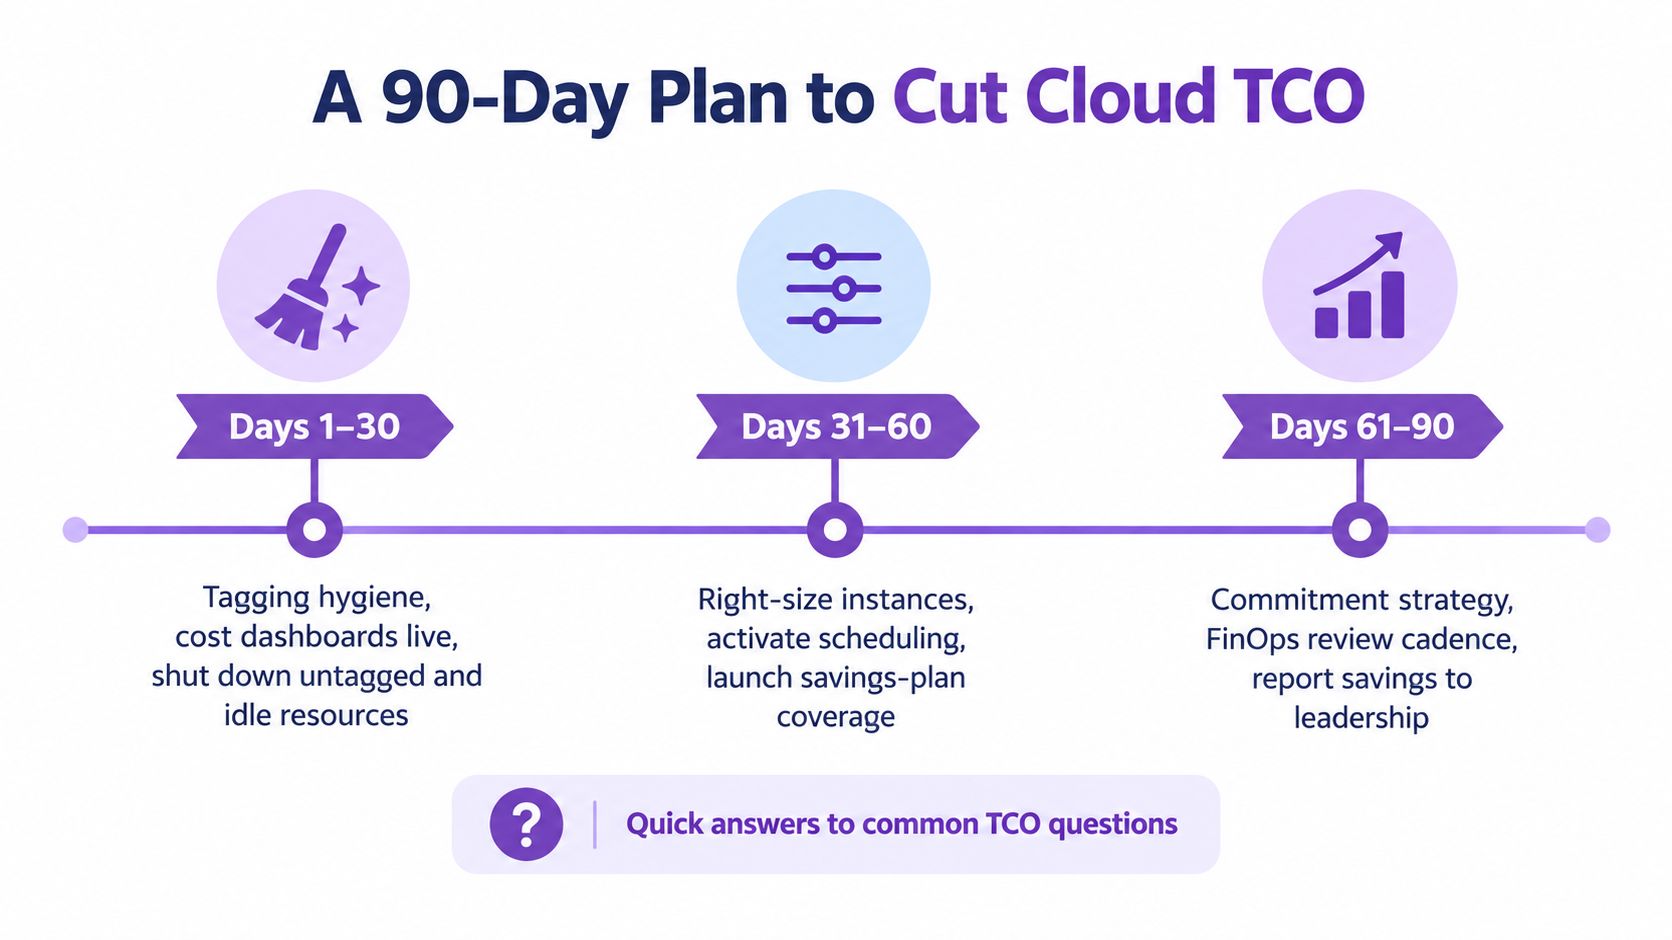
Days 1 to 30 belong to visibility. The engineering lead fixes tagging, the FinOps analyst turns on dashboards, and the finance partner agrees on reporting categories. Shut down obvious idle and untagged resources, with an exit criterion of ownership for every material resource.
Days 31 to 60 focus on action. Rightsize the largest workloads and schedule non-production environments. Exit when utilization has stabilized and scheduled changes have audit evidence.
Days 61 to 90 are for commitments and governance. Cover only proven steady-state usage with Reserved Instances or Savings Plans, then establish budget alerts and a monthly review cadence.
How accurate can TCO get? Accurate enough for decisions when assumptions are explicit and invoices calibrate the model. Do commitments work in multi-cloud? They can, but coverage must be modeled per provider and workload. How often should you refresh it? Reconcile monthly and rebuild after architecture, traffic, or contract changes. Who owns it? Engineering owns resource truth, FinOps owns the model, and finance owns the planning decision. What savings should a mid-sized SaaS expect? Don't promise a universal range. Measure the baseline, schedule idle capacity, rightsize, and report verified savings.
Server Scheduler gives teams point-and-click scheduling for AWS servers, databases, and caches, including start, stop, resize, and reboot windows. Use Server Scheduler to turn your TCO plan into repeatable operating rules, then review the measured savings with engineering, FinOps, and finance.