A Practical Guide to Linux Network Traffic Monitoring
Monitoring Linux network traffic involves capturing and analyzing the data packets that travel across your network. For anyone managing a Linux system, this is a fundamental skill for diagnosing performance issues, spotting security threats, and ensuring network reliability. From the command line to graphical dashboards, understanding the right tools for the job can transform network management from a reactive chore into a proactive strategy.
Ready to gain deep visibility into your network? Server Scheduler helps teams automate cloud infrastructure to cut costs and improve efficiency. Schedule a demo to see it in action!
Contents
Ready to Slash Your AWS Costs?
Stop paying for idle resources. Server Scheduler automatically turns off your non-production servers when you're not using them.
Why Network Observability Matters
In any modern IT environment, understanding network behavior is a necessity. For system administrators, DevOps engineers, and security professionals, network observability provides the foundation for a stable and secure infrastructure. It empowers teams to move from simply reacting to problems to proactively managing them. Without effective monitoring, you're essentially flying blind, unable to identify bottlenecks, block emerging threats, or plan for future capacity needs. Proper monitoring provides the crucial visibility needed to make informed decisions and maintain service availability.
This visibility is more critical than ever as organizations adopt cloud and hybrid infrastructures. The growth of network monitoring tools reflects this importance, highlighting how essential these practices have become for businesses worldwide. One of the primary benefits is the ability to diagnose performance and security issues rapidly. When an application slows down, the network is often the first suspect. The right tools allow you to pinpoint the source of latency, packet loss, or a bandwidth-hogging process within minutes.
 deep packet inspection (DPI) techniques can be a game-changer. Beyond immediate troubleshooting, monitoring provides the historical data needed for effective capacity planning. Analyzing traffic trends over time enables you to anticipate future bandwidth requirements and scale infrastructure before performance degrades. Linux is an exceptional platform for this, as many powerful monitoring tools are integrated directly into the kernel, exposing a wealth of real-time data through filesystems like
 /proc and /sys.
Inspecting Live Traffic with Command-Line Tools
When a network issue arises, real-time visibility is paramount. Waiting for a dashboard to update can be too slow; you need immediate, unfiltered access to what is happening on your network interfaces. This is where the power of Linux command-line tools shines, offering direct diagnostic capabilities that are essential for any administrator. These tools provide the raw data needed to troubleshoot effectively and quickly. For a raw view of network packets, the classic and indispensable tool is tcpdump. It captures and displays individual packets in real time, making it invaluable for debugging protocol-level problems. While its output can be overwhelming, its true strength lies in its powerful filtering capabilities, allowing you to isolate specific traffic based on host, port, or protocol. For example, you can capture traffic for later analysis in a tool like Wireshark or use filters to focus only on web traffic by specifying port 80 or 443.
While tcpdump excels at deep packet inspection, iftop provides a high-level overview of bandwidth usage. It displays a real-time, sorted list of active connections and their data rates, making it the perfect tool for quickly identifying which connections are consuming the most bandwidth. If you need to know which specific application is responsible for the high traffic, nethogs is the answer. It groups bandwidth usage by process ID (PID), directly linking network activity to the originating program. Finally, for inspecting the state of network sockets, the modern ss command is far more efficient than its predecessor, netstat. It pulls data directly from the kernel to show established connections, listening ports, and the processes that own them.
| Tool | Primary Use Case | Output Focus | Best For |
|---|---|---|---|
| tcpdump | Deep packet analysis and protocol debugging. | Individual raw packets and their contents. | Troubleshooting specific connection issues. |
| iftop | High-level bandwidth usage by connection. | Connections sorted by bandwidth consumption. | Identifying which hosts are causing a slowdown. |
| nethogs | Linking network traffic to specific processes. | Processes sorted by bandwidth consumption. | Finding the application causing high traffic. |
| ss | Inspecting system sockets and connections. | Detailed state of sockets (TCP, UDP, etc.). | Verifying listening services and connection states. |
Diagnosing Kernel-Level Network Performance
When application logs and high-level tools don't reveal the source of network slowdowns, it's time to dig deeper into the Linux network stack. Subtle issues buried within the kernel or related to hardware can cause significant performance degradation. This level of monitoring allows you to move beyond vague complaints and identify precise root causes, such as a network interface card (NIC) driver dropping packets due to buffer overflows. This precision is what separates professional troubleshooting from guesswork. Your investigation should begin with ethtool, a powerful utility that communicates directly with your NIC and its driver. Running ethtool -S [interface-name] provides a comprehensive list of statistics straight from the hardware. Look for counters with names like "drop," "error," or "overflow." An increasing value in these fields is a clear indicator that the NIC is discarding packets before the kernel even has a chance to process them. This could point to a faulty cable, a duplex mismatch with a switch, or an overwhelmed NIC.
If ethtool shows no hardware issues, the next step is to examine the kernel's software networking layer via the /proc/net/softnet_stat file. This file provides insight into how the kernel is handling packets after they have been received from the NIC. The second column in this file tracks packets dropped by the kernel because a CPU's input queue was full, indicating that the server is receiving data faster than it can be processed. The third column, time_squeeze, increments when the kernel's networking code runs out of its time budget to process a batch of incoming packets. A rising time_squeeze count is a classic sign of CPU contention, suggesting a network problem may actually be a CPU problem in disguise. This is a good time to ensure other resource issues aren't at play; knowing how to find a memory leak can help you rule out other common culprits.
Analyzing Historical Trends for Proactive Management
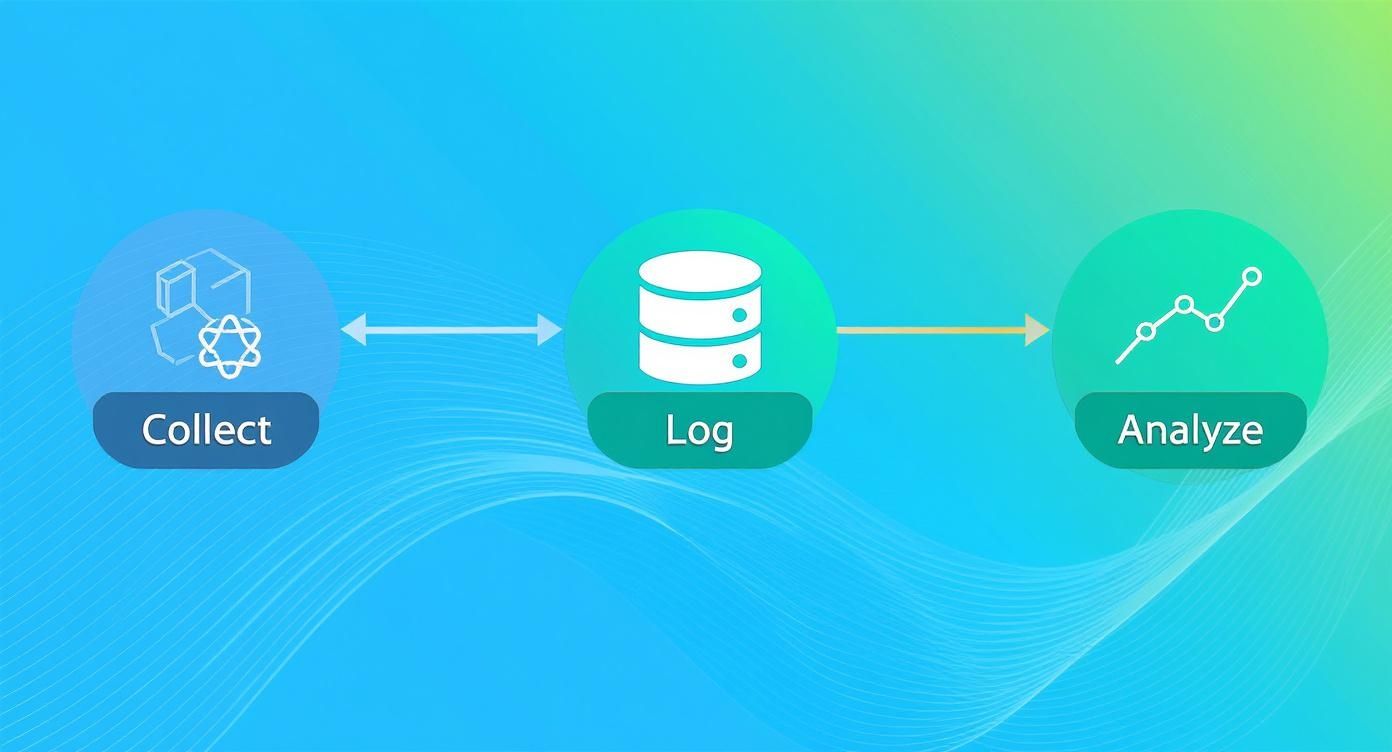
Constant, reactive firefighting is an unsustainable approach to network management. To get ahead of problems, you must shift to a proactive strategy based on understanding long-term traffic patterns. This requires tools that can log historical data efficiently without impacting system performance. This data provides the evidence needed to make informed decisions about capacity, prevent outages, and run a more cost-effective infrastructure. For simple and lightweight bandwidth tracking, vnStat is an excellent choice. It runs as a daemon, quietly collecting and storing network usage data for each interface with a minimal performance footprint. It automatically builds a persistent database of traffic, allowing you to easily query daily, weekly, and monthly bandwidth consumption. This historical perspective is invaluable for capacity planning and identifying long-term growth trends.
For more granular data collection, a system statistics daemon like collectd is the next logical step. While vnStat provides a high-level overview, collectd uses a modular plugin system to gather hundreds of system metrics, including detailed network statistics like packet counts, errors, and dropped packets. This data can be forwarded to a central monitoring server, forming the foundation of a comprehensive, long-term monitoring solution.
By analyzing historical network data, you can spot recurring patterns—like month-end report generation causing traffic spikes—and forecast future needs. This turns network management from a reactive fire drill into a predictable, data-driven strategy.
Ultimately, collecting historical data facilitates a change in mindset. Instead of waiting for an alert that your network is saturated, you can use trends from vnStat or collectd to anticipate the need for upgrades weeks or months in advance. This proactive approach leads to better capacity planning, cost optimization, and improved service reliability.
Related Articles
- Building a Modern Network Monitoring Dashboard
- How to Find a Memory Leak in Linux
- Automating Infrastructure with DevOps
Building a Modern Network Monitoring Dashboard
While command-line tools are essential for real-time troubleshooting, they don't provide the broader context needed to understand overall network health and long-term trends. For this, a graphical dashboard is indispensable. The combination of Prometheus for data collection and Grafana for visualization allows you to transform raw metrics into actionable insights. Prometheus operates by scraping metrics from various endpoints. For Linux systems, the standard tool is the node_exporter, a lightweight agent that exposes hundreds of hardware and kernel metrics, including crucial network statistics. The two key metrics for bandwidth monitoring are node_network_receive_bytes_total and node_network_transmit_bytes_total, which Prometheus collects at regular intervals and stores in its time-series database.
With data flowing into Prometheus, you can use Grafana to build interactive dashboards. Using PromQL (Prometheus Query Language), you can create panels to visualize key metrics. For example, a query like ((rate(node_network_receive_bytes_total[5m]) + rate(node_network_transmit_bytes_total[5m])) * 8) calculates the total network throughput in bits per second. This can be further broken down to show bandwidth per interface, providing a more granular view of network activity. However, a truly proactive system requires more than just dashboards; it needs alerts. Prometheus's Alertmanager component allows you to define rules that trigger notifications when certain thresholds are met.
A dashboard shows you what happened; an alert tells you what is happening right now. This proactive notification is critical for reducing downtime and responding to issues before users are impacted.
For instance, you can create a rule to send a notification to Slack or email if a server's network traffic exceeds a specific limit for a sustained period. This transforms your monitoring system into an active guardian of your infrastructure. This approach aligns with modern DevOps principles, as detailed in our guide on what DevOps automation truly means.
Solving Common Network Problems in the Real World
Knowing the theory behind network monitoring tools is one thing, but applying them effectively under pressure is another. Having a clear, repeatable troubleshooting workflow is crucial when production systems are failing. Let's walk through a few common scenarios to create a practical playbook for diagnosing network issues. First, consider a sudden spike in bandwidth usage. Your initial step should be to use iftop to get a real-time view of connections sorted by bandwidth consumption. This will immediately identify the connection responsible for the high traffic. To determine the specific process generating this traffic, pivot to nethogs, which groups network usage by process ID (PID), pinpointing the exact application causing the issue.
Another common challenge is intermittent packet loss, which can be difficult to diagnose. The mtr tool is perfect for this, as it continuously sends packets to a destination and shows latency and packet loss for every hop along the path. If mtr indicates that the loss is occurring on your own server, use ethtool -S [interface] to check for hardware-level drops. If the hardware is clean, examine /proc/net/softnet_stat for kernel-level drops, which often point to CPU bottlenecks.
Finally, when an application is slow and the network is blamed, you need to prove or disprove the theory with data. Use ss -t -i to inspect TCP connections, paying close attention to the Send-Q and Recv-Q columns. Consistently full buffers suggest the application is not processing data fast enough, pointing to an application-level issue rather than a network one. If buffers are clear, a targeted tcpdump can reveal high latency or TCP retransmissions, which are definitive signs of a network problem. Knowing how to check your Nginx configuration can also help rule out web server misconfigurations.