Mastering CPU Utilization in Linux for Peak Performance

Dealing with sluggish applications or runaway cloud bills? The answer often lies in understanding your CPU utilization in Linux. This single metric tells you how hard your processor is working, but just looking at the raw percentage won't give you the full picture. Metrics like load average and I/O wait are just as important for getting to the root of the problem.
Ready to turn performance insights into automated savings? Server Scheduler translates your server usage patterns into an automated start/stop schedule, cutting your cloud costs by up to 70% without manual intervention.
Contents
Ready to Slash Your AWS Costs?
Stop paying for idle resources. Server Scheduler automatically turns off your non-production servers when you're not using them.
Why Monitoring CPU Utilization Is Critical
Keeping a close eye on CPU utilization is fundamental for any healthy, cost-effective Linux environment. When an application grinds to a halt or a server becomes unresponsive, the first place any sysadmin looks is the CPU. High CPU usage is often the smoking gun for a performance bottleneck—a single process hogging all the available power and creating a traffic jam for every other task.
But the fallout from unmanaged CPU consumption goes way beyond just poor performance. In cloud environments like AWS, every single CPU cycle comes with a price tag. An inefficient application or an oversized server idling away can burn a serious hole in your budget. By actively monitoring Linux CPU utilization, you can pinpoint these inefficiencies and start making data-driven decisions. This proactive approach lets you right-size your instances, so you're only paying for the resources you actually use. It also helps you spot weird behavior that might signal a security problem, like a runaway process or some unauthorized software doing who-knows-what. To get the complete picture, it's smart to track other key metrics, too; our guide on Linux network traffic monitoring has some great techniques for that.
Ultimately, effective monitoring empowers you to build systems that are more resilient, efficient, and affordable. It shifts system administration from a reactive mode of constantly fighting fires to a strategic practice of continuous optimization. When you understand the nuances of your CPU metrics, you gain the control needed to fine-tune performance, cut operational overhead, and make your infrastructure truly work for you.
Real-Time CPU Monitoring on the Command Line
When your Linux system grinds to a halt, you need answers, and you need them now. Real-time monitoring is your first line of defense, giving you a live look at what’s hogging your resources. The command line is your best friend here, and for a modern and usable experience, htop is a massive upgrade over the classic top utility. It shows the same critical data but adds color-coded displays, intuitive process trees, and lets you interact with processes directly. This visual approach makes spotting a resource-hungry app incredibly simple.
🚀 Pro Tip: Viewing Per-Core Utilization
In htop, just hit the '1' key. This toggles the display from a single, aggregated CPU meter to individual meters for every single core. It’s an absolute must for spotting single-threaded bottlenecks where one core is pegged at 100% while the others are just sitting around.
The real skill in real-time monitoring is understanding the nuances. A single CPU percentage can be seriously misleading on a multi-core machine. You might see a system-wide metric showing 45% average utilization, but a closer look could reveal one core is sweating at 95% while the rest are nearly idle. This kind of imbalance is a classic sign of a single-threaded application causing a performance headache.
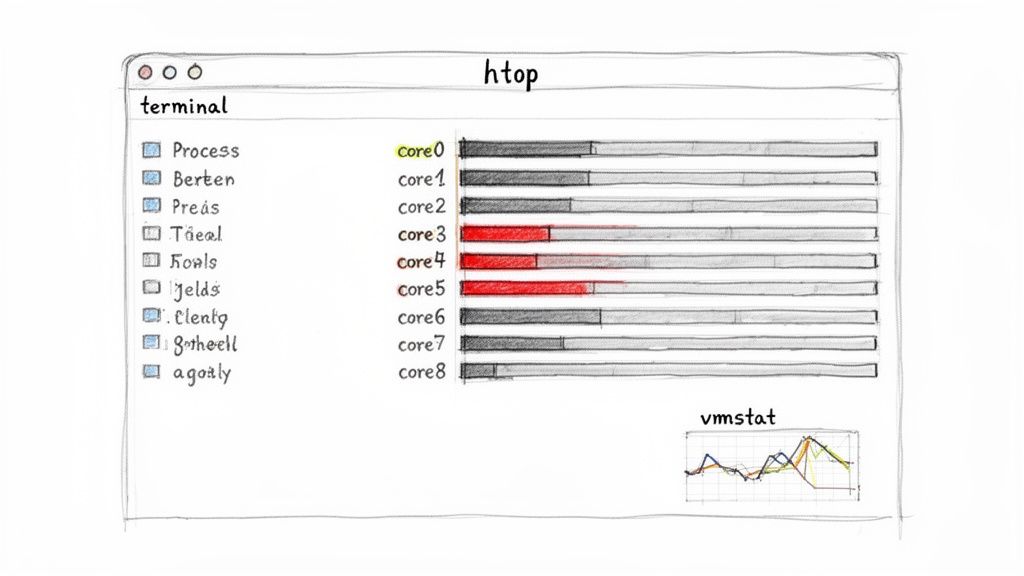
While htop is fantastic for an interactive deep-dive, sometimes you just need a quick snapshot. That’s where the ps command shines. Running ps aux --sort=-%cpu | head will instantly list the top processes currently burning the most CPU. It's incredibly handy for scripting or just a quick, non-interactive check. If you suspect a cron job has gone rogue, our guide on what to do when a crontab is not working can help you track down the problem. CPU utilization doesn't happen in a vacuum—it's tightly linked to memory, swapping, and I/O activity. To get the bigger picture, you need vmstat (virtual memory statistics). Firing up vmstat 1 gives you a continuous, second-by-second stream of system data, revealing how many processes are runnable (r), blocked (b), and gives you the lowdown on memory usage and I/O wait times. A high number in the wa (wait I/O) column alongside low user (us) and system (sy) CPU times is a dead giveaway that your storage is the bottleneck, not your CPU. Getting comfortable with these commands helps you move beyond just seeing high CPU utilization in Linux to accurately diagnosing the root cause like a seasoned pro.
| Tool | Primary Use Case | Key Feature | Best For |
|---|---|---|---|
| top | Basic system overview | Classic, universally available | A quick, no-frills check on any system. |
| htop | Interactive process management | Color-coded display, process tree | Visually identifying and managing problem processes. |
| ps | Snapshot of current processes | Highly scriptable, detailed flags | Non-interactive checks and custom reports. |
| vmstat | System-wide performance context | Shows CPU, memory, and I/O | Differentiating between CPU and I/O bottlenecks. |
Interpreting Core CPU Metrics Like an Expert
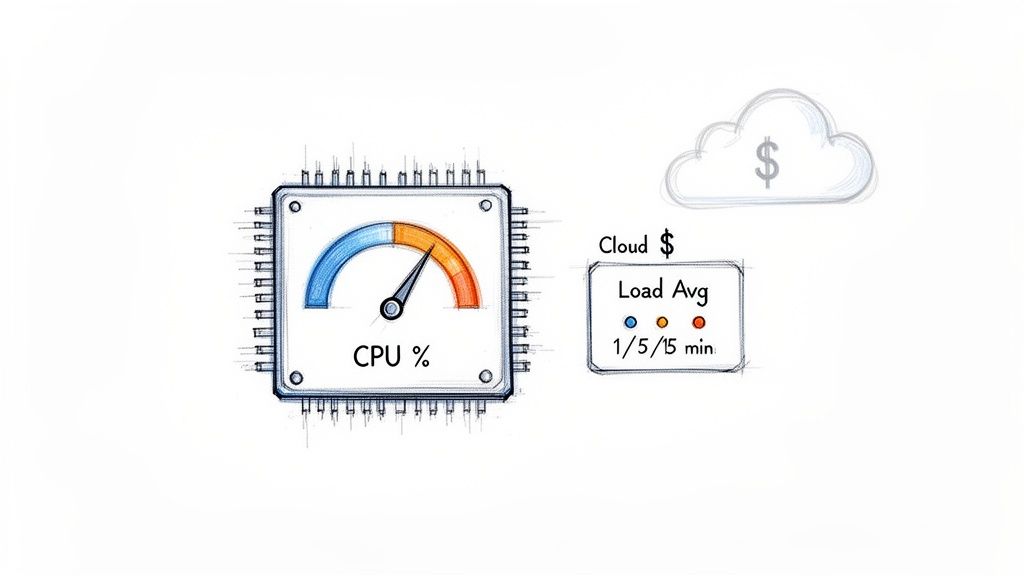
Collecting raw data with command-line tools is just the start. The real skill is knowing what those numbers actually mean for your system's health. The output from tools like top and vmstat can look like a wall of text at first, but a few key metrics tell most of the story about your CPU utilization in Linux. Learning to read them lets you move from guessing to diagnosing. One of the most common points of confusion is the difference between CPU utilization and load average. Utilization is how busy the CPU is executing tasks, while the load average is how many processes are in the queue waiting for CPU time. You can have low utilization but a high load average, which points to a different kind of bottleneck.
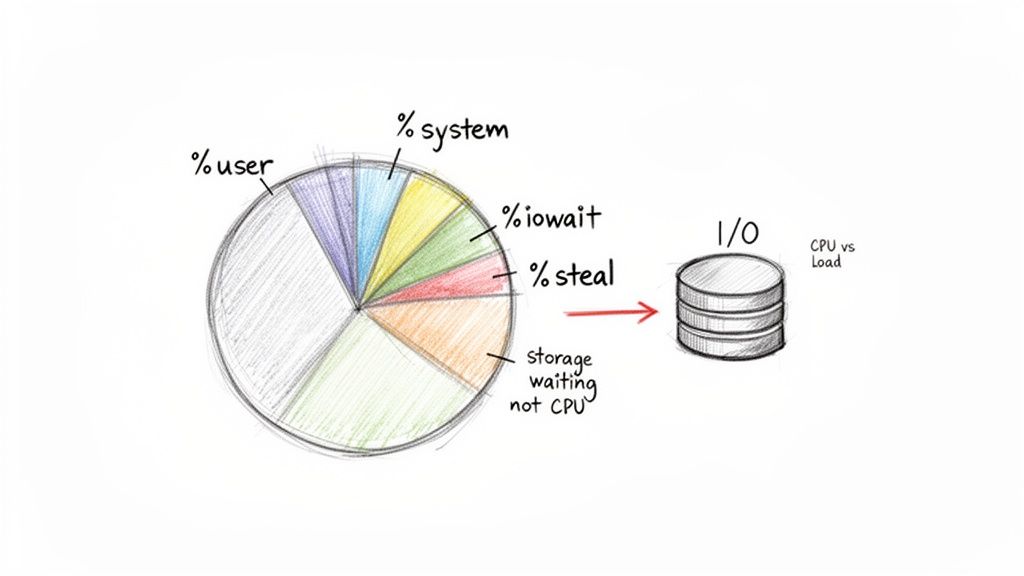
Your CPU splits its time among various tasks, which monitoring tools break down into percentages. %us (user) is time spent running your applications, and high %us is normal for a busy server. %sy (system) is time the kernel spends on system-level tasks; high %sy could mean a driver issue. %id (idle) is time the CPU had nothing to do. %wa (iowait) is idle time where the CPU is waiting for a storage device, signaling a storage bottleneck. Finally, %st (steal), seen in virtual environments, is time a virtual CPU waited for the physical CPU. High steal time means your VM isn't getting the resources it needs.
While CPU utilization gives you an instant snapshot, CPU load average tells a story about demand over time, measuring the number of processes running or waiting. Linux provides 1, 5, and 15-minute averages to show demand trends. On a single-core system, a load of 1.0 means it's fully utilized, while 2.0 means it's oversubscribed by 100%. By looking at both utilization percentages and load averages, you get a much clearer picture. A server with 90% utilization and a low load average is working hard but keeping up. In contrast, a server with 30% utilization but a high load average might be struggling with slow disk I/O, causing processes to pile up while the CPU waits. You can find more deep dives on this from the experts at Netdata.
Analyzing Historical Trends with SAR
While real-time tools like htop are fantastic for tackling performance problems happening right now, true infrastructure optimization comes from looking at the bigger picture. To really understand your system's long-term behavior, you need to analyze historical data. This is where the System Activity Reporter, or sar, becomes one of your most valuable allies for monitoring CPU utilization in Linux. sar is a powerful utility that quietly runs in the background, collecting detailed performance snapshots at regular intervals. This process builds a rich dataset that you can query to see exactly what your CPU was doing yesterday, last week, or even last month. No more guessing.
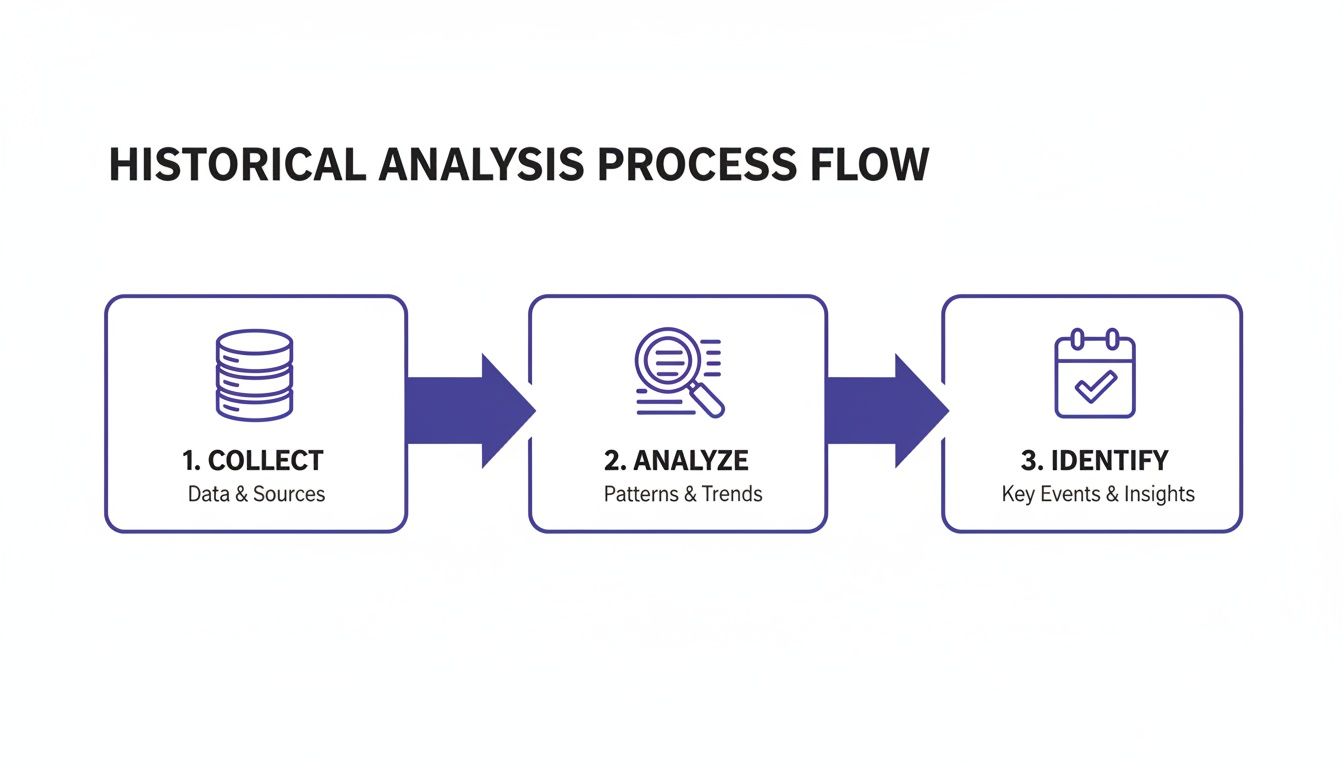
Getting started with sar is straightforward. Running sar -u will show you a report of CPU utilization for the current day. Its real power lies in looking back using the -f flag to specify a log file. For example, sar -u -f /var/log/sa/sa10 would pull up the CPU report from the 10th day of the month. Of course, accurately parsing these logs depends on correct timestamps; you can get a quick refresher on managing date and time stamps in Linux to ensure your data is always reliable. The most powerful insight you'll get from sar is identifying predictable cycles. A development server might show heavy CPU usage from 9 AM to 5 PM on weekdays but drop to nearly 0% overnight and on weekends. Recognizing these patterns is the first step toward massive cost savings. This historical data directly informs cost-saving automation, a strategy explored further in resources covering Linux system statistics with SAR.
The metrics from sar are gold for capacity planning and cost optimization. By tracking CPU states like %user, %system, %iowait, and %idle over weeks or months, you can uncover clear usage trends. By mastering sar, you gain the ability to make informed decisions based on how your systems actually behave over time, not just how you assume they do.
Turning Monitoring Insights into Cloud Savings
Knowing how to measure and interpret CPU utilization in Linux is more than just a diagnostic skill. The real win comes when you turn those insights into tangible business outcomes—namely, a smaller cloud bill. Your historical data from sar or cloud provider dashboards is a goldmine, telling a clear story of when your resources are earning their keep and when they're just sitting there costing you money. For non-production environments like dev, staging, and QA, these idle periods are often long and predictable.
The first step is to dive into your historical CPU data and hunt for those predictable lulls in activity. A classic example is a server that's busy during business hours—say, 9 AM to 6 PM, Monday to Friday—but drops to near-zero utilization every night and all weekend. Once you spot a server with a clear on/off cycle, you can map out a simple but powerful schedule for it: start the instance just before the team needs it and shut it down right after the workday ends. Applying this logic to just one development server can wipe out over 120 hours of paid-for, unused compute time every single week. This kind of smart resource management is a key component of good infrastructure hygiene, and there are many great capacity planning strategies that can help you think about this at a broader level.
Identifying these patterns is a great start, but manual management is tedious and error-prone. Automation is the necessary next move. The goal is to create a "set it and forget it" system with a tool like Server Scheduler. By automating the schedule you’ve defined, you ensure resources are active only when necessary, guaranteeing that you never pay for idle infrastructure. This automated approach is a cornerstone of any real cost management strategy. When you systematically shut down non-essential resources during their downtime, you're directly tackling cloud waste at its source. For organizations looking to get the most out of their budget, exploring wider cloud cost optimization strategies provides a solid roadmap.
Frequently Asked Questions
When you're digging into CPU utilization on Linux, a few questions pop up time and time again. There’s no single "good" CPU utilization percentage; it depends entirely on the workload. A data processing server might run at 80-90% utilization normally, while a web server spiking to that level could indicate a problem. The key is to establish a baseline for your server and investigate any major deviations. As a general rule, sustained utilization above 70% warrants a closer look.
To find which process is causing high CPU usage, interactive command-line tools like htop are your best friend. It provides a real-time, sortable list of processes, with the heaviest consumers at the top. If htop isn't available, top works, and for a quick, scriptable snapshot, ps aux --sort=-%cpu | head -n 10 will instantly list the top 10 CPU hogs.
For checking CPU usage in Docker containers, the docker stats command is essential. It gives a live-updating stream of resource metrics for all running containers, including CPU percentage, memory usage, and network I/O. To focus on a single container, you can append its name or ID, like docker stats my-app-container, simplifying the debugging process for specific microservices.
Related Articles
- FinOps best practices: Translate your technical metrics into tangible cost-saving strategies for your cloud infrastructure.
- Cloud Cost Optimization Strategies: Discover a roadmap for systematically reducing your cloud spend across the board.
- How to Build a Crud No Code API Scalable Backend: Gain insights into creating cost-effective and efficient system architecture from day one.