How to Find Windows Uptime for Servers and PCs

Knowing how to find Windows uptime is a fundamental skill for anyone managing Windows systems, but this simple metric offers more than just a timestamp. The time since the last reboot tells a powerful story about your system's stability, security, and even its cost-efficiency. While the quickest method is to open Task Manager, go to the Performance tab, and check the "Up time" value, a deeper understanding of this data can transform how you manage your infrastructure, turning a simple number into actionable business intelligence.
Stop guessing and start scheduling. Server Scheduler helps you automate server start/stop times to slash your AWS bill. Discover how to cut cloud costs without complex scripts.
Contents
Ready to Slash Your AWS Costs?
Stop paying for idle resources. Server Scheduler automatically turns off your non-production servers when you're not using them.
Why Tracking Windows Uptime Is a Business Priority
Understanding your system's uptime is far more than a technical checkbox; it's a vital sign for your operational health, security posture, and financial efficiency. For anyone in DevOps, FinOps, or IT leadership, this data is a goldmine of actionable intelligence. It’s the metric that exposes servers that have missed critical security patches, identifies "zombie" instances quietly racking up unnecessary cloud costs, and gives you the baseline you need for smart maintenance planning. That simple timestamp connects directly to real business outcomes, making it a key performance indicator for any well-run IT department.

This data is also crucial for preventing catastrophic failures during deployments. Let's say you spot a server that's been running for over 180 days. While that might look like rock-solid stability, to a security team, it’s a massive red flag. A long uptime almost always means the server hasn't been rebooted to apply critical security updates, leaving it vulnerable to exploits. For an operations team, that same metric could point to a forgotten development server burning through the department's cloud budget. A quick uptime check could have flagged the long-running process and saved you from an outage, aligning with the benefits of proactive IT support for preventing costly downtime.
In cloud environments like AWS, every minute of compute time comes with a price tag. Long uptimes on non-production servers—think development, staging, or QA environments—often point to significant, and completely avoidable, waste. By analyzing uptime patterns, you can confidently schedule shutdowns for resources that aren't needed 24/7. This simple change can lead to substantial savings, as detailed in our guide on how to properly start and stop EC2 instances.
Uptime Is a Foundational Metric Uptime isn't just a number; it's a cornerstone of a well-run, secure, and cost-effective infrastructure. Monitoring it proactively prevents minor issues from becoming major incidents.
Quick Ways to Find Uptime on a Local Windows Machine
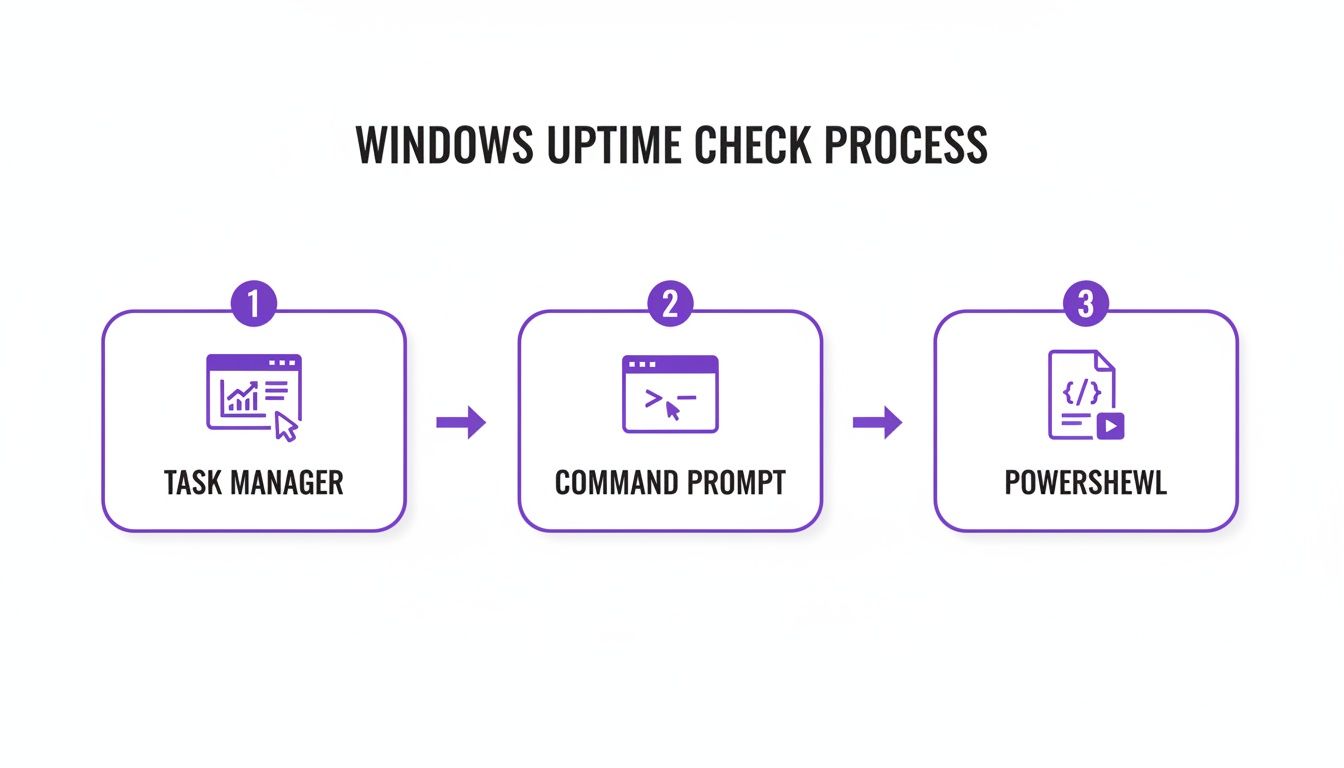
When you need to know how long a single Windows machine has been running, several built-in tools can provide an answer in seconds. These methods are perfect for a quick spot-check on a PC or server without needing complex scripts. The most user-friendly option is the Task Manager. Simply press Ctrl+Shift+Esc, navigate to the Performance tab, and you'll find "Up time" clearly displayed at the bottom. It shows the duration in a days:hours:minutes:seconds format, making it ideal for a fast, non-technical check.
For those more comfortable on the command line, the systeminfo command is a classic. Open a Command Prompt or PowerShell window and type systeminfo. After a moment, it will display a wealth of system configuration details, including the "System Boot Time." It is important to note that this provides a specific timestamp (e.g., 10/26/2023, 9:05:15 AM) rather than a duration, telling you when the system started, not how long it's been running. This is useful for precise logging and complements other shutdown procedures, like those detailed in our guide on the command prompt shutdown command.
The cleanest and most modern command-line method is using PowerShell's Get-Uptime cmdlet. Introduced in PowerShell 6, this command provides a direct and unambiguous answer. Just open a PowerShell window and run Get-Uptime. The output is a simple, easy-to-read duration, giving you the clarity of Task Manager with the speed and scriptability of the command line.
| Method | Interface | Best For | Output Format |
|---|---|---|---|
| Task Manager | GUI | Quick visual checks by any user. | Duration (DD:HH:MM:SS) |
| systeminfo | CMD / PowerShell | Getting the exact boot timestamp for logs. | Timestamp (MM/DD/YYYY, HH:MM:SS) |
| Get-Uptime | PowerShell | Fast, scriptable, and direct uptime duration. | Duration Object (Days, Hours, etc.) |
Scaling Uptime Checks with PowerShell
When you're managing more than a couple of servers, checking uptime one by one is inefficient and impractical. This is where PowerShell transitions from a handy command-line tool to the core of your systems administration toolkit. Its true power is revealed when you use it to query hundreds of remote machines in seconds. The magic ingredient for this is the Invoke-Command cmdlet, which lets you run script blocks on multiple remote computers simultaneously. By providing a list of server names, you can pull uptime data from your entire fleet into a single, clean report. Automating such checks is fundamental to maintaining a healthy and efficient infrastructure. For a broader perspective on streamlining operations, our guide on cloud infrastructure automation tools offers valuable insights.
Before the Get-Uptime cmdlet became standard, system administrators relied on Windows Management Instrumentation (WMI) and the Common Information Model (CIM). These methods are still incredibly valuable, especially when working with older systems or needing more than just a duration in a complex script. The modern, and recommended, approach is using Get-CimInstance because it's faster and more network-friendly. The command Get-CimInstance -ClassName Win32_OperatingSystem | Select-Object LastBootUpTime grabs the precise timestamp of the last boot. For any of these remote commands to work, Windows Remote Management (WinRM) must be enabled and correctly configured on the target servers, along with the necessary permissions.
Advanced Uptime Auditing and History
Sometimes, knowing the current uptime isn’t enough. For security audits, compliance reporting, or serious troubleshooting, you need a detailed historical record of a system's availability. This is where we move from simple checks to digital forensics, piecing together a server's operational timeline. The best tool for this is the Windows Event Viewer, which acts as the system's black box recorder. By filtering the System log for specific Event IDs, you can uncover a clear history of reboots.
Key Event IDs include 6005 (Event Log service started, indicating a boot-up), 6006 (Event Log service stopped, marking a clean shutdown), and 1074 (logging when a user or application initiated a restart, often with a reason). Filtering for these events helps you build a timeline that answers not just "how long has it been on?" but also "when did it last stop, and why?" This level of detail is invaluable for investigating unexpected outages and understanding the different date and time stamps systems use for auditing.
For tracking long-term stability and identifying intermittent reboots, Performance Monitor is another excellent tool. It allows you to track the "System Up Time" counter over extended periods, graphing the data to reveal patterns that might otherwise be missed. This forensic work is critical, as IT system and software-related issues are the leading cause of downtime, accounting for 31% of all data center outages, according to a recent analysis. You can read the full analysis from the Uptime Institute for more detail.
Finding Uptime in Cloud Environments Like AWS
When managing a fleet of Windows servers in a dynamic cloud environment like AWS, traditional methods of checking uptime don't scale. Logging into each EC2 instance individually is a waste of time. Cloud-native tools provide powerful ways to monitor uptime across your entire infrastructure without needing a single RDP session. A prime example is AWS Systems Manager (SSM) Run Command, which lets you execute PowerShell scripts like Get-Uptime across targeted groups of instances simultaneously. This method is secure, auditable, and a best practice for managing large fleets.

You can also leverage cloud-native metrics. In AWS, every EC2 instance has a Launch Time property visible in the console or accessible via the AWS CLI, which serves as an excellent proxy for its maximum possible uptime. Additionally, Amazon CloudWatch tracks metrics like StatusCheckFailed_System, where a spike indicates an instance became unresponsive or rebooted. This cloud-first approach is essential for achieving the high-availability targets modern businesses demand. For context, top providers often detail their service continuity standards, like Microsoft's M365 service continuity, demonstrating the high bar for reliability.
Common Questions About Windows Uptime
As you integrate uptime monitoring into your workflow, several common questions often arise. A frequent point of confusion is the distinction between system uptime and process uptime. System uptime measures the time since the Windows operating system last booted. Process uptime, however, tracks how long an individual application or service has been running. A critical service can crash and restart without the server ever rebooting, meaning a server with 150 days of system uptime could have a key process that has only been running for 15 minutes. Relying solely on system uptime can create a false sense of security about application availability.
Another common question relates to how sleep and hibernation modes affect the uptime counter. The answer is simple: neither sleep nor hibernation resets the uptime clock. When a machine enters these low-power states, the core OS session is paused, not terminated. Upon waking, the uptime counter resumes from where it left off. Finally, for proactive management, you can set up reboot alerts using the Windows Task Scheduler. By creating a task triggered by Event ID 6005 (system startup), you can execute a PowerShell script to send an email or chat notification, ensuring you are immediately aware of any reboot, whether planned or unexpected.
Ready to turn uptime data into cost savings? Server Scheduler lets you visually automate when your AWS resources run, cutting cloud waste without writing a single script. Get started with Server Scheduler.