A DevOps Guide on How to Test for Packet Loss
 Start a free trial and see how much you can save.
Contents
Ready to Slash Your AWS Costs?
Stop paying for idle resources. Server Scheduler automatically turns off your non-production servers when you're not using them.
Understanding the Impact of Packet Loss on Cloud Performance
When your cloud applications feel sluggish or database queries start timing out, the first instinct for many DevOps teams is to check CPU utilization or memory pressure. But what if the problem isn't on the server at all? What if it's the silent killer of cloud performance: packet loss. This subtle but devastating issue often goes completely undiagnosed, leading to frustration, wasted engineering hours, and a bloated cloud bill from overprovisioning resources that don't even touch the real issue. For DevOps teams, ignoring packet loss is like trying to fix a leaky pipe by just turning up the water pressure—it only makes the problem worse.
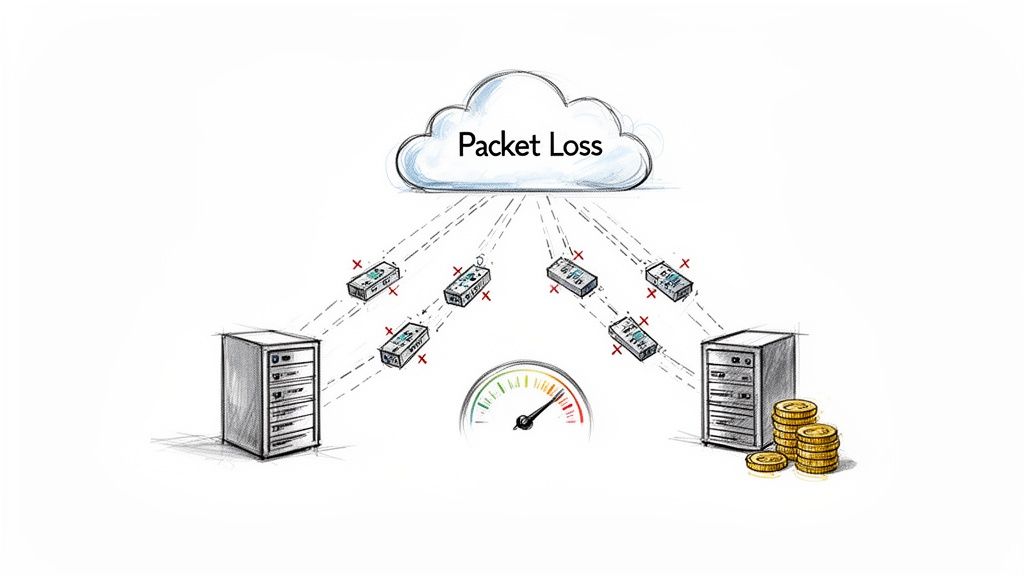
Packets are the lifeblood of your network, carrying everything from API requests to database results. When some of them vanish, the consequences ripple through your entire infrastructure. This can happen for various reasons, including network congestion, faulty hardware, software bugs, or even ISP throttling. The impact isn't always a full-blown outage. It might manifest as a slightly slower app response, a cron job that fails intermittently, or connection drops that are impossible to reproduce. It’s easy to underestimate how damaging even a tiny amount of packet loss can be. Since TCP is built for reliability, a missing packet forces the sender to retransmit it, adding significant latency. Research has shown that just 1% packet loss can cause throughput to crash by over 70%, turning a minor network hiccup into what feels like a major outage. You can dig into the specifics in the full research on packet loss impact.
Essential Tools for Initial Packet Loss Diagnosis
Before you can fix packet loss, you have to find it. The first diagnostic step is turning vague complaints like "the app is slow" into hard, actionable data. This involves using a first-response toolkit of essential commands to get a quick read on network health, whether you're on a local machine or a cloud server. The real skill lies not just in running these commands but in knowing how to interpret their output. By getting comfortable with a few key utilities, you can test for packet loss and begin tracing the problem back to its source, whether it’s hiding in your own virtual private cloud (VPC) or somewhere out on the public internet.
The ping command is the oldest and simplest tool for a reason: it works. It sends a small ICMP packet to a target and measures the round-trip time (RTT) and the percentage of packets lost. A continuous ping helps identify patterns, such as consistent drops or erratic latency, which are classic signs of network congestion. While ping tells you if you have a problem, traceroute (or tracert on Windows) helps you figure out where it is by mapping every hop a packet takes. A sudden jump in latency or a line of asterisks at a specific hop often pinpoints the culprit router. For a more dynamic and comprehensive view, mtr (My Traceroute) combines ping and traceroute into a single, continuously updating report. This makes it far better at catching intermittent issues that a one-off traceroute might miss, providing a live look at loss percentage and latency for each hop.
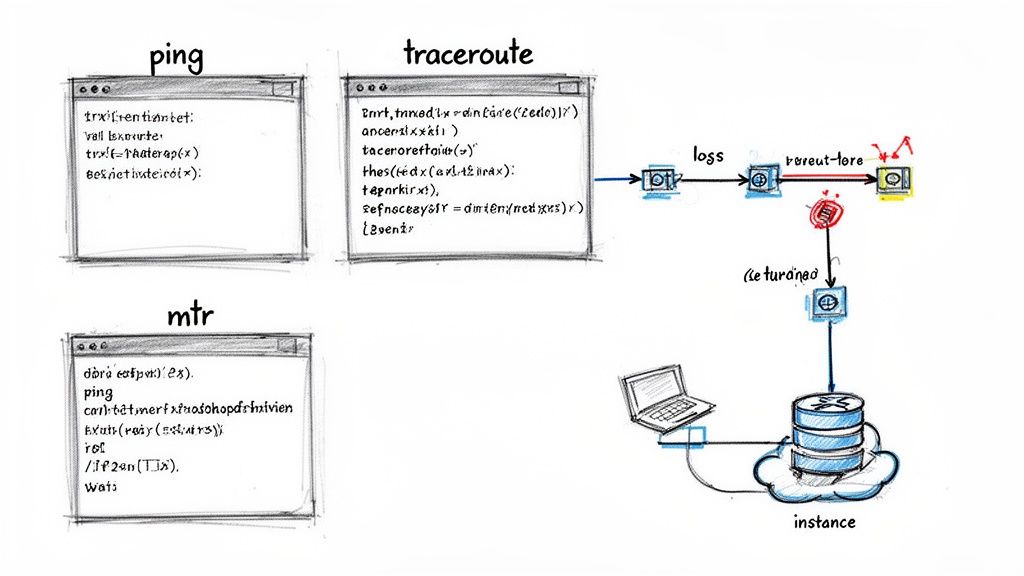
The most important thing to look for in a
tracerouteormtris where the trouble begins. If packet loss starts on the first or second hop, the problem is almost certainly on your local network. If it starts many hops away, well after leaving your provider's network, the issue is probably outside of your control.
Getting comfortable with these three commands gives you a solid foundation for network troubleshooting. If you're looking for more tips on system diagnostics, check out our guide on how to find Windows uptime and server reboot history. With these utilities, you can quickly move from symptom to diagnosis.
Advanced Network Analysis for Deep Dives
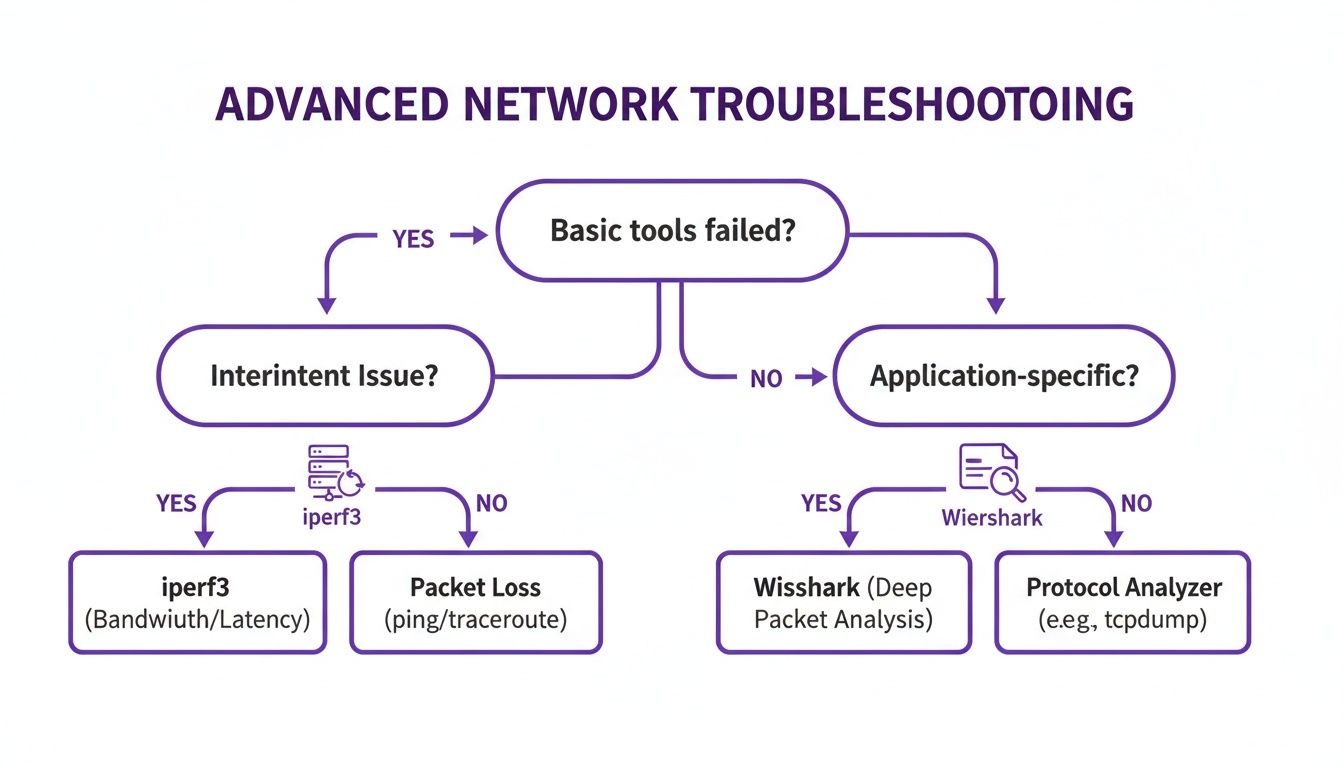
When standard tools like ping and mtr don't provide the full story, it's time to bring in more advanced utilities. These tools offer a forensic-level view of your network, helping you understand not just if packets are being lost, but how and why they disappear under real-world conditions. This deeper insight is crucial when you need to test for packet loss that only affects your actual services, not just a basic ICMP test. Sometimes, the network path appears fine, yet your application struggles because the problem only emerges under specific loads or with certain types of traffic, such as the UDP streams used in video calls.
One of the most powerful tools for this job is iperf3. Unlike ping, iperf3 is designed to measure maximum network throughput by flooding the path between a client and a server with data. This active testing approach is perfect for uncovering performance bottlenecks and packet loss that only surface when your network is under pressure. For example, you can run an iperf3 test between two cloud instances to measure real-world bandwidth across availability zones. It can also simulate UDP traffic, which is invaluable for directly measuring the packet loss your real-time applications might experience, as UDP has no built-in retransmission mechanism.
While iperf3 actively tests your network, tools like Wireshark and tcpdump take a passive approach by listening to and capturing live traffic. tcpdump is a lightweight command-line utility perfect for capturing traffic on remote servers, which you can then analyze with the more user-friendly Wireshark. Wireshark provides a graphical interface to dissect every packet, allowing you to filter through millions of packets, reconstruct data streams, and automatically flag TCP issues like retransmissions and duplicate acknowledgments—the smoking guns of packet loss.
| Tool Category | Tools | Approach | Best For |
|---|---|---|---|
| Active Testing | iperf3 |
Generates traffic to measure throughput and simulate specific loads. | Quantifying maximum bandwidth, stress-testing network links, and measuring UDP packet loss directly. |
| Passive Analysis | Wireshark, tcpdump |
Captures and inspects existing network traffic without generating new packets. | Deep-dive forensic analysis, diagnosing application-specific issues, and identifying TCP retransmissions. |
Using these advanced tools, you can move from vague symptoms to concrete evidence, empowering you to solve even the most elusive network problems. If you're dealing with complex network configurations, you might find our guide on how to build a proxy server a helpful resource for managing traffic flow.
Interpreting Results and Diagnosing Root Causes
Running tools like ping or mtr is the easy part; the real work begins when you must translate that raw output into a clear plan of action. Seeing 5% packet loss is a starting point, but it doesn't explain why it's happening. This is where you shift from being a data collector to a network detective. The clues are all there in the test results, waiting for you to piece them together. It’s about building a mental framework for diagnosing the different ways packets go missing. Is it a flaky cable, an overloaded router, or a subtle configuration mistake? Answering that question is how you move from just spotting a symptom to actually fixing the problem.
To get good at this, you need to recognize the "fingerprints" of common network problems. Each type of failure leaves a distinct signature in your diagnostic reports. Link-based issues, like a bad cable or failing switch port, typically show up as consistent packet loss at a single, specific hop in your mtr results. Host-related problems, such as an overloaded CPU on a server or router, often manifest as intermittent loss that aligns with high server load. The most frequent cause, network congestion, is a traffic jam where more data is trying to pass through a link than it can handle. Its classic sign is packet loss that spikes during peak hours and disappears at night, almost always accompanied by a jump in latency.
A much sneakier cause of packet loss is a Maximum Transmission Unit (MTU) mismatch. If a packet is too large for a network segment, it gets fragmented. This isn't inherently bad, but if a router is configured to drop fragmented packets for security reasons, it can lead to mysterious loss that only affects certain traffic, like VPNs. Keeping good records of network changes, complete with proper date and time stamps, can be a lifesaver when correlating these issues with recent configuration updates. Developing a diagnostic instinct is about using your tools to form a theory and then running more tests to prove or disprove it, connecting the "what" from your tools to the "why" of network behavior.
Automating Network Monitoring for Proactive Management
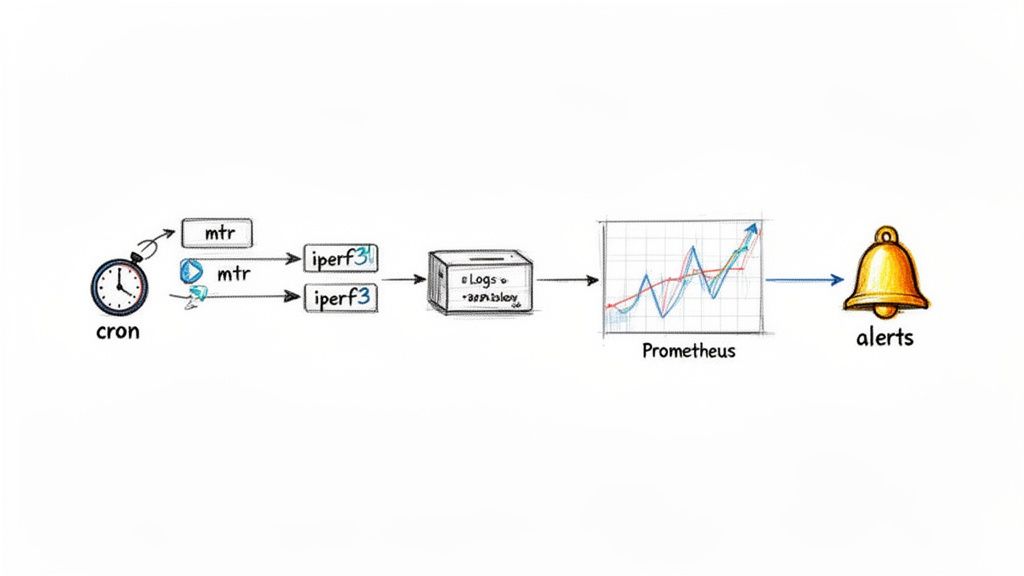
In a dynamic cloud environment, manually spot-checking for packet loss is a losing game. Intermittent glitches that cause issues are often gone by the time you run a test. The only way to get ahead is to shift from a reactive, manual approach to a proactive, automated one. This means building a system that constantly monitors your network's health, catching issues before they escalate into user-facing problems. This strategy transforms network monitoring from a frantic troubleshooting exercise into a calm, data-driven process. Instead of waiting for things to break, you’ll have a system that learns your network’s baseline and alerts you the moment something deviates.
The journey to automation can start with a simple shell script that runs mtr or iperf3 tests between critical servers every five minutes, logging the output with a timestamp. This historical record becomes your source of truth, allowing you to go back and see exactly what the packet loss and latency looked like at a specific moment. The next step is to integrate these automated checks into a monitoring platform like Prometheus. By exposing test results as metrics, you can build dashboards in Grafana to visualize your network's performance over time and set up powerful alerting rules to notify you automatically when packet loss exceeds a predefined threshold.
One of the most effective ways to use automation is by tying network health checks directly to infrastructure changes. Manual operations like server reboots or resizes are notorious for causing unexpected network problems. Automating health checks before and after these events provides an immediate and invaluable feedback loop. This approach is a game-changer for infrastructure reliability, providing an instant pass/fail verdict on every scheduled change. This is where tools for automated infrastructure management can significantly streamline operations and ensure consistency, transforming network health from an afterthought into a core part of your operational discipline.
Frequently Asked Questions About Packet Loss
When you're deep in the trenches diagnosing network issues, the same questions tend to pop up repeatedly. For DevOps engineers on the front lines, getting fast, clear answers is everything. This section serves as a quick reference for troubleshooting packet loss, covering the essentials from what constitutes an "acceptable" level of loss to determining if the problem is on your end or with your ISP. These answers should help you cut through the noise and get to a solution faster.
The "acceptable" threshold for packet loss really depends on the application. For real-time services like VoIP or online gaming, even 1% loss is a disaster, causing stuttering and a terrible user experience. For general web browsing, up to 2-3% loss might not break the application but will make it feel sluggish. However, in any professionally managed cloud environment, the goal should always be to get as close to 0% packet loss as possible. Anything else indicates a problem that needs fixing.
To determine if packet loss is your ISP's fault or an issue on your local network, mtr is your best tool. If you see packets dropping at the first or second hop, the culprit is almost certainly inside your local network—a flaky Wi-Fi connection, a bad cable, or a struggling router. If the first few hops are clean and the loss consistently starts further down the line, it's time to investigate your Internet Service Provider (ISP). Finally, it's important to remember that high latency and packet loss are different problems, though they often appear together. High latency simply means packets are taking a long time to travel, which could be due to physical distance. Packet loss means they never arrive at all. You can absolutely have high latency with 0% packet loss, especially when connecting to a server on the other side of the world.
Tired of wasting money on idle cloud resources? Server Scheduler automates your start/stop and resize schedules with an easy-to-use visual interface. Cut your AWS bill by up to 70%—start your free trial today!
Related Articles
- How to analyze CPU utilization in Linux environments
- A Deep Dive into TCP vs UDP for Application Performance
- How MTU Settings Can Impact Application Performance