Mastering Format Table PowerShell for Clear Reports

If you've ever run a PowerShell command and been hit with a wall of text, you know the feeling. Format-Table, or its much handier alias ft, is your best friend for cutting through that noise. It takes a chaotic jumble of object data and whips it into a clean, structured table you can actually read.
Ready to automate your server management tasks? Server Scheduler helps you cut cloud costs by scheduling server operations with a simple, visual interface. Start saving time and money—discover how Server Scheduler works today!
Contents
Ready to Slash Your AWS Costs?
Stop paying for idle resources. Server Scheduler automatically turns off your non-production servers when you're not using them.
Why Taming PowerShell Output Matters
In the world of system administration and DevOps, clarity isn't just nice—it's essential. Raw PowerShell output is packed with useful information, but it's often a dense stream of properties and values that are nearly impossible to scan quickly. This is where Format-Table becomes a core skill. It’s not just about making things look pretty; it's about turning data into something you can act on. By neatly organizing everything into columns and rows, you can instantly compare attributes across different items, spot anything that looks out of place, and share your findings with colleagues in a format that makes sense.
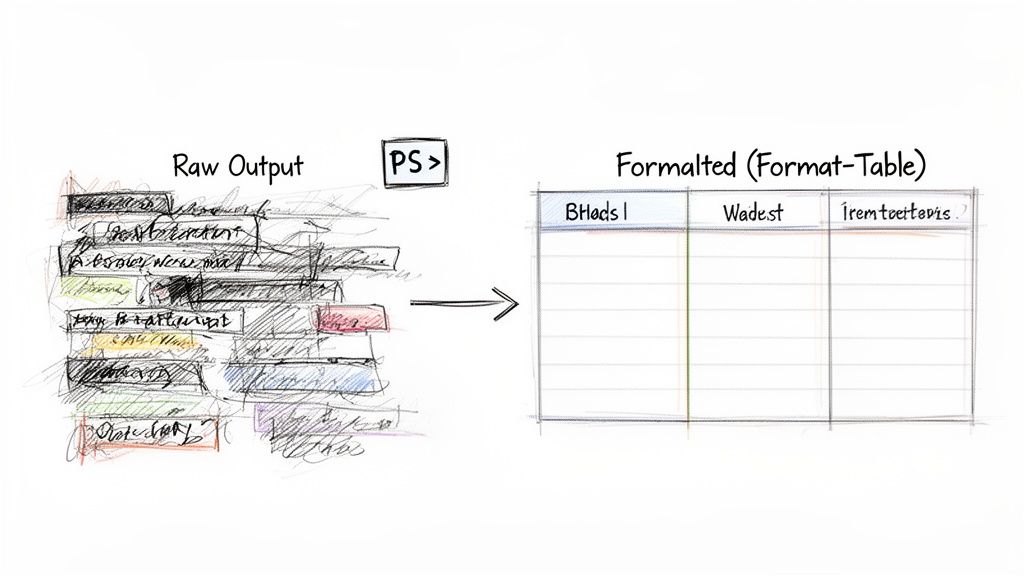
When you pipe the output of a command like Get-Process to Format-Table, everything changes. Suddenly, you have a perfectly organized table with clear columns like Handles, NPM(K), PM(K), WS(K), and ProcessName. This immediate jump in readability is why ft is everywhere. In fact, its alias ft shows up in an estimated 70-80% of PowerShell scripts in enterprise environments, a testament to just how indispensable it is. Clear output is a cornerstone of maintainable code, a concept that aligns with broader Clean Code Principles. When your script's output is clear, debugging and maintenance become infinitely easier. For example, you could use it to whip up a quick report on system uptime, a task we cover in our guide on how to find Windows uptime with PowerShell.
Selecting Your Columns for a Custom View
Moving beyond the default display is the first real step to making Format-Table work for you. By default, PowerShell does its best to guess which columns are important, but its choices often don't match what you actually need. This is where the -Property parameter comes in—it's the main tool you'll use to take control and build a custom view. The -Property parameter lets you specify exactly which properties (or columns) you want to see, cutting through all the noise. Instead of getting a dozen columns when you only care about three, you can create a focused, clean table that highlights the precise information your task requires. This is fundamental for writing clear and predictable scripts.
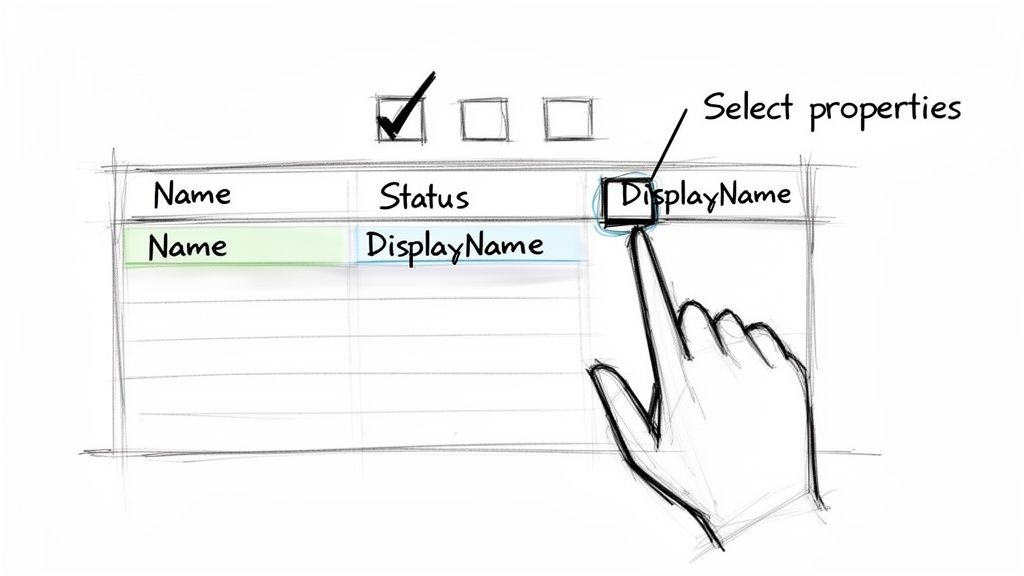
Using the parameter couldn't be simpler. After the Format-Table cmdlet, just add -Property followed by a comma-separated list of the property names you want to show. For example, the default output for Windows services can be overwhelming. To get a targeted report showing only the service's name, its current status, and its descriptive display name, you'd run this command: Get-Service | Format-Table -Property Name, Status, DisplayName. That simple change transforms the messy default output into a concise report that's way easier to read. On a related note, if you ever need to dig into specific file content, our guide on how to grep for text in binary files can be a real lifesaver. You can even use the asterisk (*) wildcard to grab multiple properties that share a similar name, a fantastic shortcut that saves typing.
Pipeline Best Practice: Always remember that formatting cmdlets like
Format-Tableshould be the very last command in your pipeline. These cmdlets turn rich data objects into simple text formatting, which means you can't pipe them to other commands likeWhere-ObjectorExport-Csvfor more processing. Format last!
Building Dynamic Reports with Calculated Properties
While selecting existing columns is a great start, the real magic of Format-Table begins when you create your own. This is where the cmdlet evolves from a simple display tool into a dynamic, on-the-fly reporting engine. With calculated properties, you can add new columns that don't exist on the original object, transforming your data into something far more insightful. This lets you perform calculations, reformat data, or combine information directly within your command. No more exporting data to manipulate it somewhere else—you can generate a polished report right from the PowerShell pipeline.
The syntax for a calculated property is a hash table passed to the -Property parameter: @{Name='CustomColumn'; Expression={$_.OriginalProperty}}. This structure tells PowerShell to create a new column with a specific name (Name or n) and defines the script block for what goes into that column (Expression or e). For example, Get-Process shows memory usage in bytes, which isn't very human-friendly. We can convert this to megabytes (MB) right in the output: Get-Process | Format-Table -Property ProcessName, @{Name="Memory (MB)"; Expression={$_.WS / 1MB -as [int]}}. This simple addition makes your reports much more useful. This approach is far more efficient than writing complex loops, a concept familiar to anyone working with other scripting languages. For more on efficient scripting, our Bash scripting cheat sheet provides some helpful parallels.
Fine-Tuning Your Table's Appearance and Structure
Calculated properties are a game-changer, but the real polish comes from controlling your table's overall layout. A well-structured table is just as important as the data it holds. One of the most common frustrations is when Format-Table chops off your data with ellipses (...). The quickest fix is the -AutoSize parameter. When you add -AutoSize to your command, PowerShell intelligently adjusts each column's width to fit the widest piece of data, guaranteeing nothing gets cut off. For example, Get-Service | Format-Table -Property Name, DisplayName -AutoSize ensures the full display name is always visible.
While -AutoSize is fantastic, it can sometimes create tables that are too wide. This is the perfect time to use the -Wrap parameter. Instead of stretching columns, -Wrap breaks long text and stacks it within the column, keeping your table compact.
| Parameter | Behavior | Best For |
|---|---|---|
| -AutoSize | Widens columns to fit the largest data item. | Columns with moderately long but varied data. |
| -Wrap | Keeps column width and wraps long text onto new lines. | Columns with very long text strings, like paths or notes. |
The real organizational magic comes from the -GroupBy parameter. This feature lets you categorize your output based on a specific property, transforming a flat list into a structured report. A classic example is grouping running services by their Status: Get-Service | Sort-Object Status | Format-Table -GroupBy Status. This simple grouping trick has helped DevOps teams cut down manual data sifting time by an estimated 50-70%. This is especially handy when you're managing complex infrastructure, a topic we explore in our guide on cloud infrastructure automation tools.
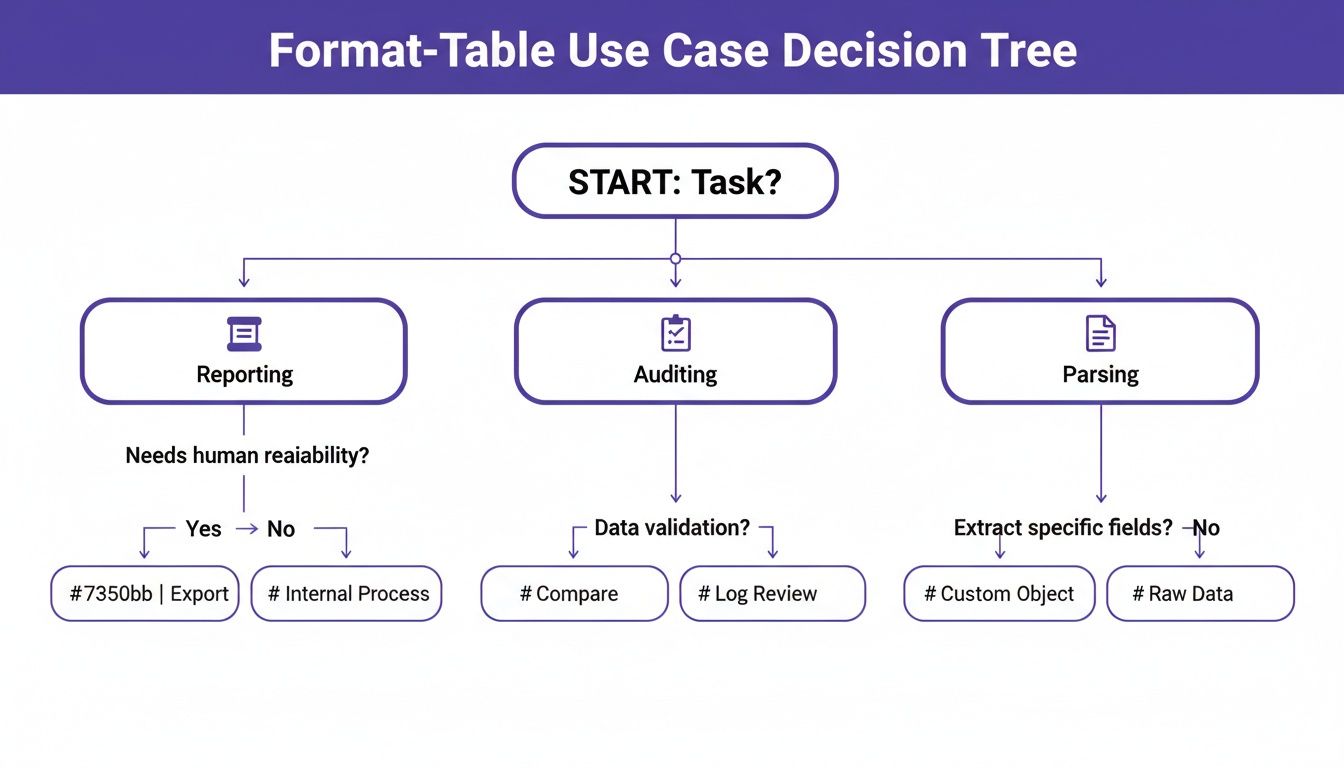
Putting Format-Table to Work in Real-World DevOps
Theory is one thing, but the real test is seeing how Format-Table solves actual problems. These examples pull together everything we've covered to provide practical scripts you can use in your daily DevOps work. For a deeper dive into applying these kinds of tools for operational visibility, check out a Founder's DevOps for Startups Playbook. One of the most frequent tasks for any sysadmin is checking if critical services are running. This script hones in on a specific list of services and generates a clean, at-a-glance health report right in your console, using a calculated property for an immediate status check.
# Define the critical services you want to monitor
$criticalServices = "WinRM", "Spooler", "wuauserv"

# Get the services, create a custom status column, and display the report
Get-Service -Name $criticalServices |
  Format-Table -Property DisplayName, Status, @{
    Name       = 'Health'
    Expression = { if ($_.Status -eq 'Running') {'OK'} else {'ALERT'} }
  } -AutoSize
The magic here is the Health column, which instantly flags any service that isn’t running. This is a perfect little script to bake into a daily startup routine. Similarly, when working in the cloud, getting a quick inventory of your virtual machines is essential. This next example uses the AWS PowerShell module to pull a list of EC2 instances and presents a tidy summary, showing the instance name, type, and state. If you need to take the next step with remote management, like scheduling a server restart, the principles are similar to what we cover in our guide on how to remotely restart a PC.
Common Format Table Questions Answered
Even after you get the hang of Format-Table, a few common questions tend to pop up. The most common mistake is trying to pipe the output of Format-Table to another command like Export-Csv. This fails because Format-Table converts rich PowerShell objects into formatting instructions meant only for display. Once that conversion happens, the original data is gone. Export-Csv needs the original, structured objects to build a proper file. The golden rule is that formatting cmdlets like Format-Table should always be the very last command in your pipeline.
Another frequent point of confusion is the difference between Select-Object and Format-Table. Think of it this way: Select-Object is for shaping your data, while Format-Table is for presenting your data. Use Select-Object anytime you need to create a new, trimmed-down object that you can continue to process with other commands. Only use Format-Table when your final goal is to display that data for a human to read.
Finally, if your tables become too wide, use -AutoSize to adjust column widths or -Wrap to stack long text within cells. If the output is still too unwieldy, a table might not be the right format. In that case, simply pipe your command to Format-List (or fl) instead. This displays each object as a vertical list of properties and their values, which is often far more readable for objects with lots of data.
Related Articles
- How to Find Windows Uptime with PowerShell
- A Bash Scripting Cheat Sheet for Quick Reference
- How to Remotely Restart a PC using Command Line
Stop wasting money on idle cloud resources. With Server Scheduler, you can automate the start and stop times for your AWS servers, databases, and caches, cutting your cloud bill by up to 70%. Try Server Scheduler now and see how much you can save.